
Google Sheets: 10 fórmulas para exprimir tus datos
Las Google Sheets u hojas de cálculo de Google se han convertido a día de hoy en una herramienta imprescindible para muchas empresas. Y es que ofrecen la mayoría de las funcionalidades de las hojas de cálculo tradicionales con la ventaja de estar en la nube. De esta manera, podemos trabajar por equipos haciendo cambios individualmente sobre un mismo archivo que se autoguarda en tiempo real.
Una vez tenemos creado nuestro entorno en Google Drive con una cuenta de Google, podremos comenzar a trabajar nuestros datos para el análisis. Porque dependerá de la naturaleza y la complejidad de nuestros datos pero, en la mayoría de casos, será necesario realizar algunas transformaciones (reagrupar, reordenar, seleccionar los datos, etc.) para posteriormente sacar conclusiones con nuestro análisis y/o representación gráfica.
Fórmulas imprescindibles para Google Sheets
1. CONCATENAR
Esta fórmula la podemos utilizar para unir datos que se nos han facilitado de manera separada en columnas pero que nos interesa tenerlos de manera conjunta. De esta manera enlazamos valores de diversas columnas, aunque también podemos anexar un valor constante que queramos introducir:
CONCATENAR(valor1; valor2)
En el ejemplo además utilizamos el espacio en blanco para delimitar, pero podemos usar cualquier otro valor si queremos separar.

2. SI
Devuelve un valor si una expresión es verdadera y otro si la expresión es falsa.
SI(expresión_lógica; valor_si_verdadero; valor_si_falso)
El segundo valor es opcional (si se omite, aparecerá un FALSO cuando se cumpla) pero es importante asegurarse que el orden de los valores es el correcto, incluyendo siempre en primer lugar el valor si la expresión es verdadera.
Aquí un ejemplo muy sencillo de la función SI para categorizar una variable numérica:

3. SUMAR.SI
Una variante de la fórmula anterior, pero en este caso sumaremos los valores de un rango únicamente si cumplen la condición que le indiquemos.
SUMAR.SI(intervalo; criterio; [intervalo_suma])
Resulta útil para obtener el sumatorio de un grupo de productos en base a un texto, como en el siguiente ejemplo (cuando contenga el texto “Tomate”), pero también podemos establecer un criterio numérico, sumar cuando un valor sea positivo, por ejemplo.

4. CONTAR.SI
Útil también para conocer información sobre un determinado subconjunto de los datos que tenemos. Esta fórmula nos devuelve un conteo simple de los registros que cumplen un determinada condición.
CONTAR.SI(intervalo; criterio)
En el siguiente ejemplo, nos permite saber cuántos alumnos son mayores de edad. Pero podríamos también contabilizar con más de un criterio y para ellos utilizaríamos la fórmula CONTAR.SI.CONJUNTO

5. BUSCARV
Nos permite buscar verticalmente un valor dentro de una columna o rango y nos devuelve el valor de una celda concreta de la fila encontrada.
BUSCARV(valor_búsqueda; intervalo; índice; [está_ordenado])
Se recomienda especificar FALSO en el argumento está_ordenado para la mayoría de los casos ya que, por defecto se indica como VERDADERO, a no ser que tengamos ordenada la primera columna del intervalo.
En este ejemplo, queremos buscar un ID dentro de una lista de productos y saber de qué producto concreto se trata (columna 2 del rango).

6. SI.ERROR
Esta fórmula de Google Sheets podemos combinarla con otras fórmulas para evitar que nos salga un mensaje de error, por ejemplo, el #¡DIV/0! al dividir una cantidad entre cero. Concretamente nos devuelve el primer argumento si el valor no ofrece ningún error y nos devuelve el segundo si existe error.
SI.ERROR(valor; [valor_si_error])
Por ejemplo, queremos indicar que hay que revisar una operación en la que no se han vendido unidades pero que ha generado coste.

7. IMPORTRANGE
A veces ocurre que necesitamos insertar en un nuevo documento de Google Sheets un rango de datos o una hoja completa de otro documento.
IMPORTRANGE(clave_hoja_cálculo; cadena_intervalo)
Una vez hayamos dado el permiso necesario de acceso al documento de origen, esta vinculación será dinámica, es decir, cualquier cambio que hagamos en los datos de origen se replicarán en la hoja de destino.

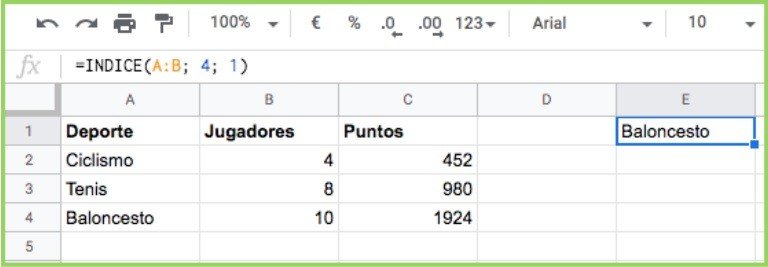
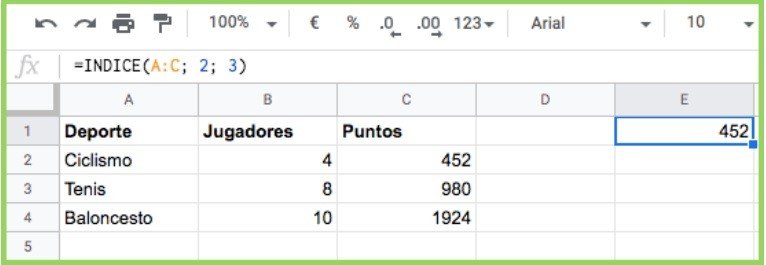
8. INDICE
Nos devuelve el contenido de una celda, especificado por número de fila y de columna.
INDICE(referencia; [fila]; [columna])
Donde referencia es la matriz de celdas por la que desplazarse, y fila y columna (opcionales), para indicar la posición de cada una de ellas si queremos posiciones concretas.
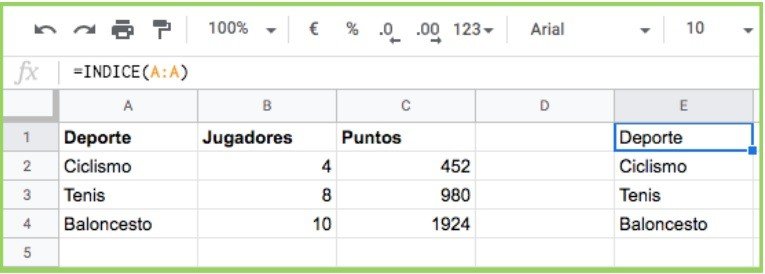
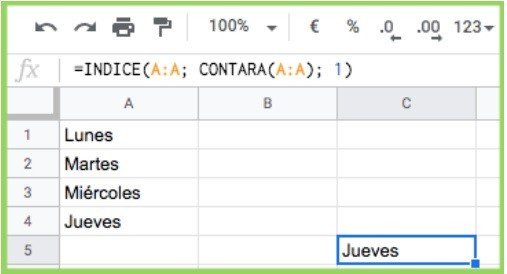
Por otra parte, Google Sheets no cuenta con una función ULTIMO() para mostrar el último valor de un rango, pero a continuación podemos ver cómo combinando la sencilla fórmula INDICE() podemos conseguirlo.
Y es que a veces los conjuntos de datos que tenemos en Google Sheets no son fijos, hay actualizaciones que nos alteran las filas y/o las columnas, añadiendo periódicamente nuevos valores. Esto no supondría ningún problema si utilizamos los datos en una tabla dinámica o le damos cualquier otra salida, pero si tenemos fórmulas referenciadas, puede que dejen de funcionar con estas actualizaciones periódicas.
Por tanto, combinando las fórmulas INDICE() y CONTARA() podemos conseguir el último valor de un intervalos de datos, o por ejemplo también, obtener la diferencia entre la última fila y la inmediatamente anterior.
=INDICE(A:A; CONTAR(A:A); 1)
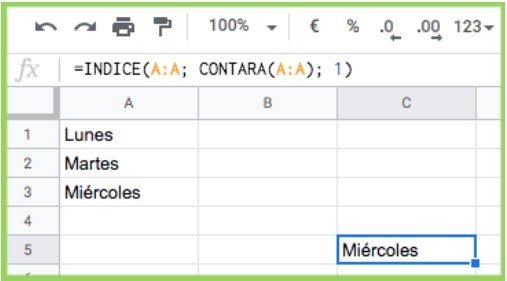
Observamos que, sin modificar la fórmula, al añadir una nueva fila, el valor que nos devuelve se ha actualizado:
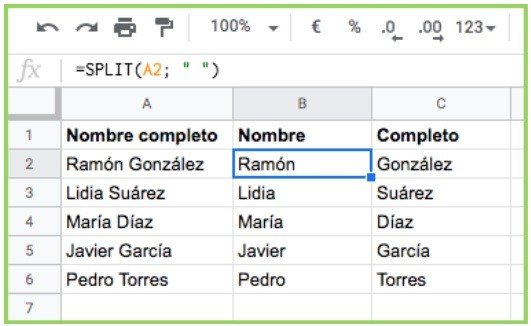
9. SPLIT
Nos permite dividir el texto de una celda en base a un carácter o una cadena específicos. Podemos considerarla la fórmula inversa a la de concatenar que hemos comentado al inicio del post.
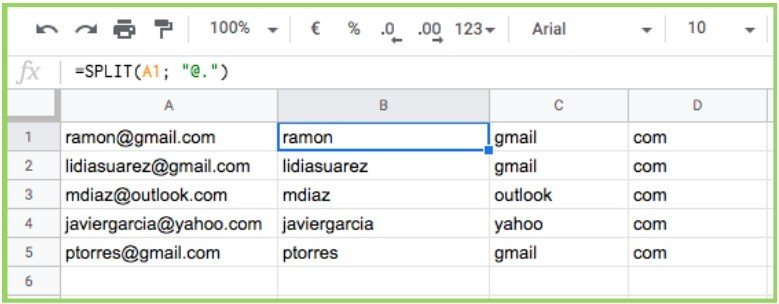
SPLIT(texto; delimitator; [dividir_por_carácter]; [quitar_texto_vacío])
Donde texto representa el texto que se quiere dividir y el delimitator el carácter o caracteres que se van a utilizar para la división del texto. Y hay que tener en cuenta que este carácter o caracteres no se van a incluir en el resultado final.
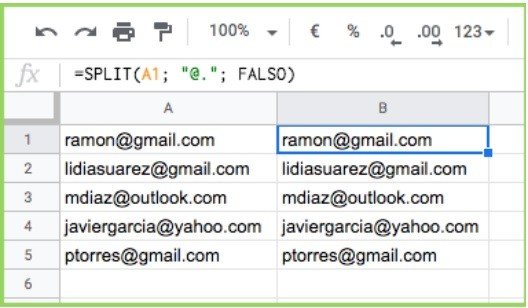
Con dividir_por_carácter (VERDADERO, por defecto), la fórmula considera cada carácter delimitador de manera individual, mientras que si lo indicamos como FALSO, la fórmula considera el delimitador como un todo.
Mientras que con quitar_texto_vacío (VERDADERO, por defecto), indicamos a la fórmula que elimine de los resultados obtenidos los valores vacíos.
Mientras que si añadimos FALSO, la fórmula tratará al delimitador @. como un todo y no realizará ninguna separación, ya que en el texto no encontramos el delimitador de manera conjunta.
10. TABLA DINÁMICA
Las tablas dinámicas de Google Sheets son un complemento a las fórmulas imprescindible si estamos trabajando con cierto volumen de datos. Representan de una manera agregada los datos con los que contamos y podemos ordenarlos o filtrarlos para tener una visión sintetizada.
Para abrir una tabla dinámica de nuestros datos, bastará con seleccionar el conjunto que queremos mostrar y hacer clic siguiendo la ruta Datos > Tabla Dinámica
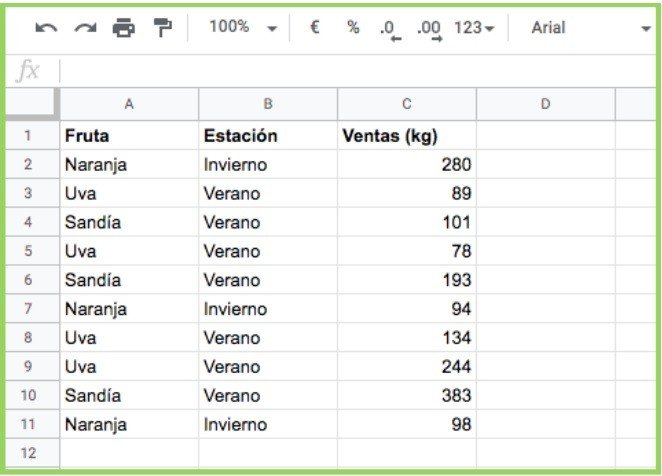
Para el conjunto de datos anterior, una sencillo ejemplo sería el de ordenar las frutas y clasificarlas según la estación a la que correspondan, mostrandos el sumatorio de las ventas.
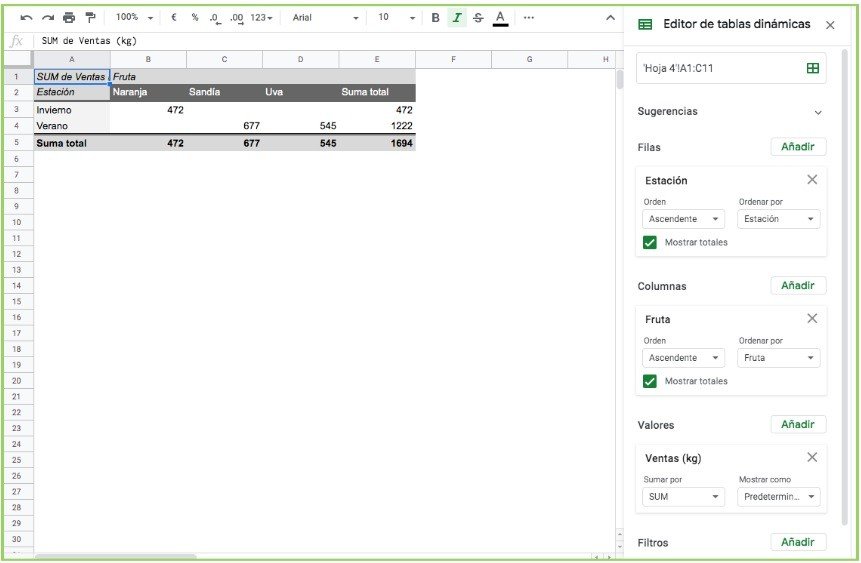
También tenemos la opción de mostrar valores medios u otras valores estadísticos, en lugar de los sumatorios. Además de modificar el orden de filas-columnas. Y otra de las opciones que más nos pueden ayudar son los Filtros, permitiéndonos mostrar únicamente un parte de nuestros datos.
Por tanto, tenemos múltiples opciones y, a medida que contemos con más dimensiones y métricas, podremos ir cruzando en distintas tablas para tener un conocimiento mayor de nuestros datos.
Y estas son algunas de las fórmulas de Google Sheets para trabajar con datos, aunque aquí está la Lista de funciones de Hojas de cálculo de Google completa.
Lo interesante es que estas fórmulas se pueden anidar y conseguir operaciones más avanzadas, como hemos visto. No es nada raro trabajar con 3 o 4 fórmulas combinadas para usos más específicos.
¿Conocías estas fórmulas de Google Sheets? ¿Qué otras fórmulas utilizas en Google Sheets para transformar tus datos?