Informes de Google Analytics personalizados
Los informes personalizados nos ayudan a concentrar los datos y resumirlos, de forma que nos ayuden a analizar los datos que realmente nos interesan. Deja de utilizar los informes que encuentras por defecto, y empieza a configurar informes de Google Analytics con las métricas deseadas.
Empecemos: Google Analytics cuenta en su interfaz con informes estándar estructurados en las siguientes categorías:
- Informe en tiempo real, refleja los datos en tiempo real de una página web. Por ejemplo, podemos conocer el número de usuarios que hay en nuestro sitio web en este momento.
- Audiencia, reporta los datos sobre usuarios: usuarios recurrentes vs usuarios nuevos, usuarios por dispositivo, ciudad, sexo…
- Adquisión, nos permite conocer de dónde procede el tráfico de nuestro sitio web, así como los resultados de las campañas etiquetadas, Adwords y medios sociales.
- Comportamiento, con este informe podemos conocer las páginas más visitadas de nuestro sitio web y todo lo relacionado con éste: velocidad de carga del sitio, búsquedas en el site, eventos…
- Conversiones, es el informe más relevante si cuentas con una ecommerce, ya que nos refleja los datos sobre embudos multicanal, objetivos y comercio electrónico.
Como vemos, con estos informes obtenemos un gran volumen de datos pero, ¿necesitamos conocer todos estos datos? Seguramente no. Es por este motivo que en Digital Menta os recomendamos generar Informes Personalizados en Google Analytics que nos van a ahorrar tiempo y vamos a poder conocer aquella información que realmente nos aporta valor. Para establecer las métricas y dimensiones que realmente te interesan en tu día a día, identifica el objetivo y quiénes van a utilizar la información, esto te permitirá definir el formato y datos que necesitas.
Una vez realizado el informe, de forma diaria, semanal o mensual puedes exportar los datos en excel o pdf y trabajar con éstos como consideres.
Cómo crear informes de Google Analytics personalizado paso a paso
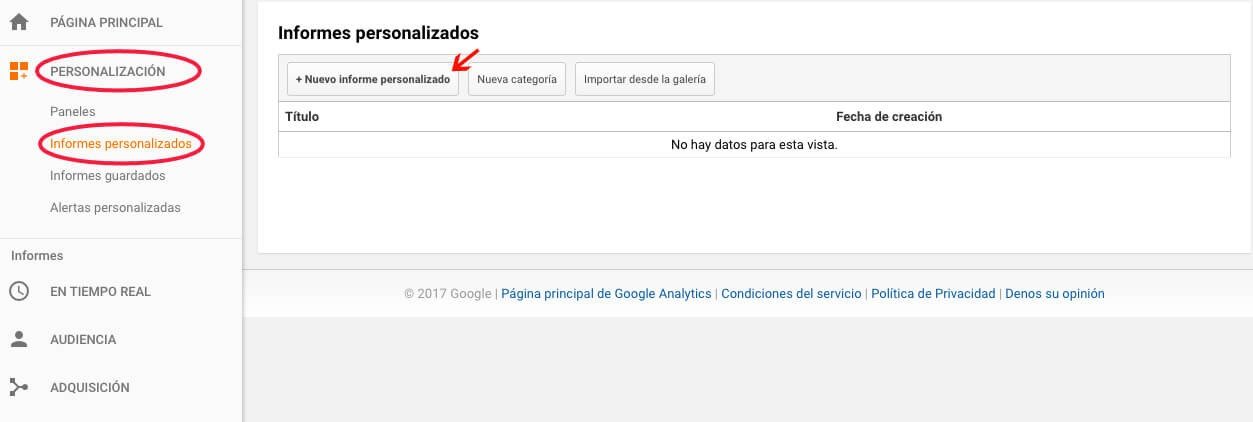
Como hemos comentado, los informes personalizados nos aportan una gran autonomía. Para crearlos, entramos en nuestra cuenta de Google Analytics, en el apartado Personalización-> Informes personalizados y hacemos clic en + Nuevo Informe Personalizado.
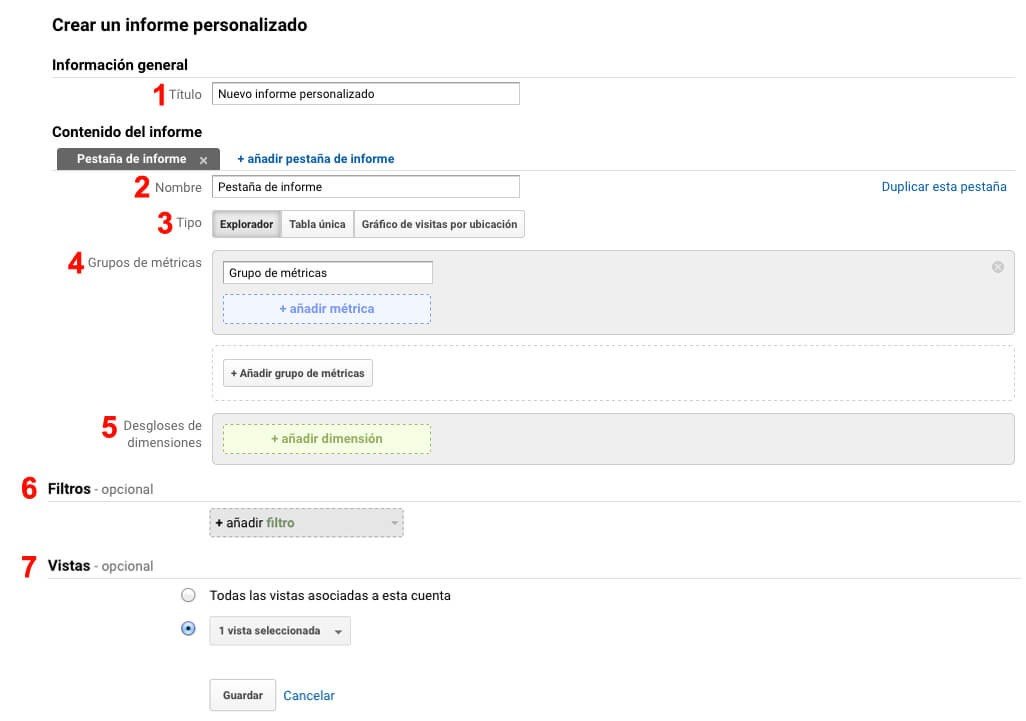
Al entrar, observamos la siguiente plantilla:
Como observamos en la imagen, el informe está estructurado de la siguiente forma:
- Título del informe. Os recomendamos poner un título lo más descriptivo posible para que os resulte sencillo identificar de forma rápida el informe. Por ejemplo, “Informe transacciones Ecommerce”.
- Nombre pestaña de informe. Podemos crear varias pestañas para segmentar los datos y cada pestaña puede tener un tipo de informe: explorador, tabla única o gráfico de visitas por ubicación.
- Tipo de informe. Google Analytics nos permite visualizar los datos de 3 formas diferentes:
- Explorador, es un informe estándar en el que nos aparece una gráfica y los datos estructurados en una tabla. Por defecto, nos muestra la primera dimensión y podemos añadir dimensiones secundarias.
- Tabla Única, es un informe en el que solo obtenemos datos, sin gráficos, y los muestra en filas. En este informe, observamos todas las dimensiones que hayamos elegido.
- Gráfico de visitas por ubicación, muestra los datos en un mapa por países y ciudades de acuerdo a la ubicación geográfica que hayamos utilizado. Los datos de visitas aparecen indicados por colores.
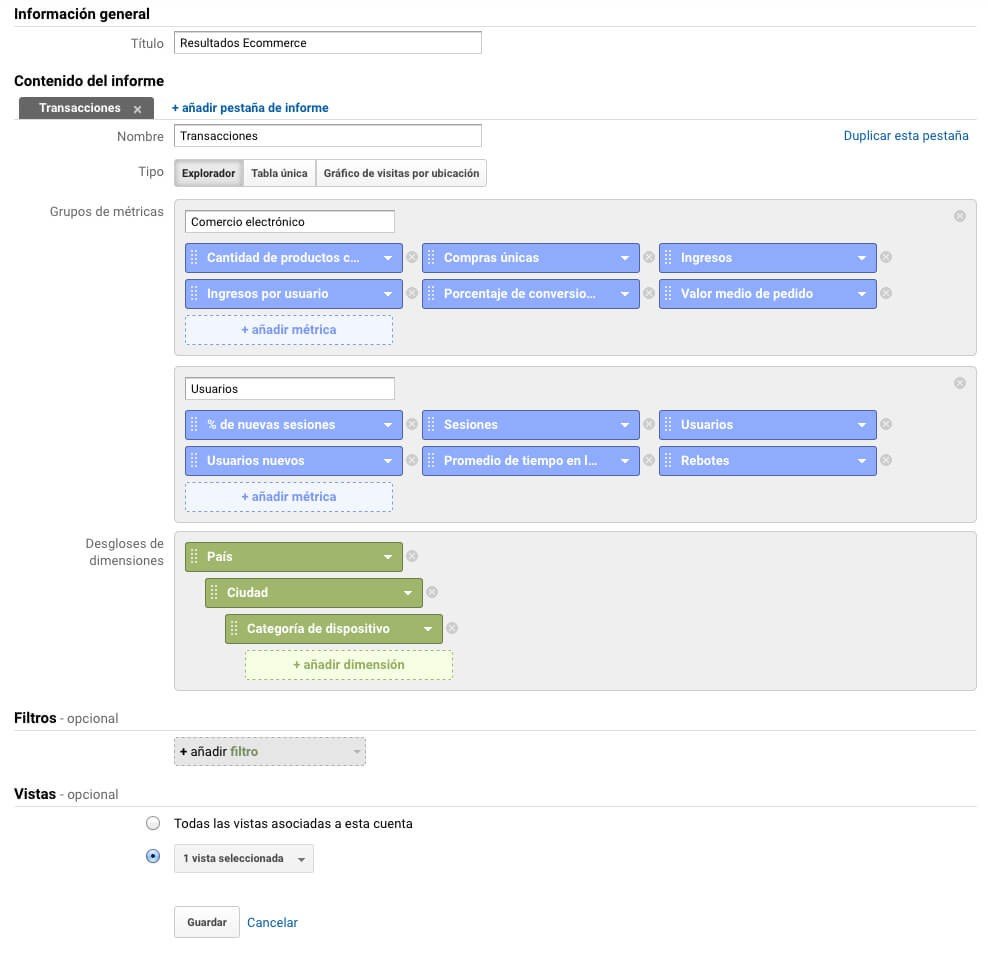
- Grupos de métricas. En el grupo de métricas seleccionamos aquellos datos que queremos visualizar en el informe, que irán en función del tipo de negocio. Imaginemos una ecommerce, podemos crear un informe de resultados con dos grupos de métricas:
- Comercio electrónico, para medir ingresos, valor medio de pedidos y cantidad de productos comprados. Para ello, seleccionamos las siguientes métricas:
- Cantidad de productos comprados
- Compras únicas
- Ingresos
- Ingresos por usuario
- Porcentaje de conversiones de comercio electrónico
- Valor medio del pedido
- Usuarios, con las siguientes métricas:
- Sesiones
- Usuarios
- Usuarios nuevos
- % de nuevas sesiones
- Promedio de tiempo en la página
- Rebotes
- Desglose de dimensiones. En este apartado, seleccionamos las dimensiones que queramos conocer. Continuando con el ejemplo anterior, en el caso de mi ecommerce quiero cruzar las métricas comentadas anteriormente con los usuarios por país, ciudad y dispositivo.
En la siguiente imagen, observamos el caso práctico comentado con el tipo de informe Explorador:
- Es opcional, y nos sirve para focalizar el análisis en un aspecto en concreto, por ejemplo, conocer los datos para una página de destino en concreto.
- Vistas. Es opcional, podemos escoger a qué vistas se va aplicar el informe personalizado.
Y una vez establecidos todos estos aspectos, ¡ya tenemos el informe personalizado!
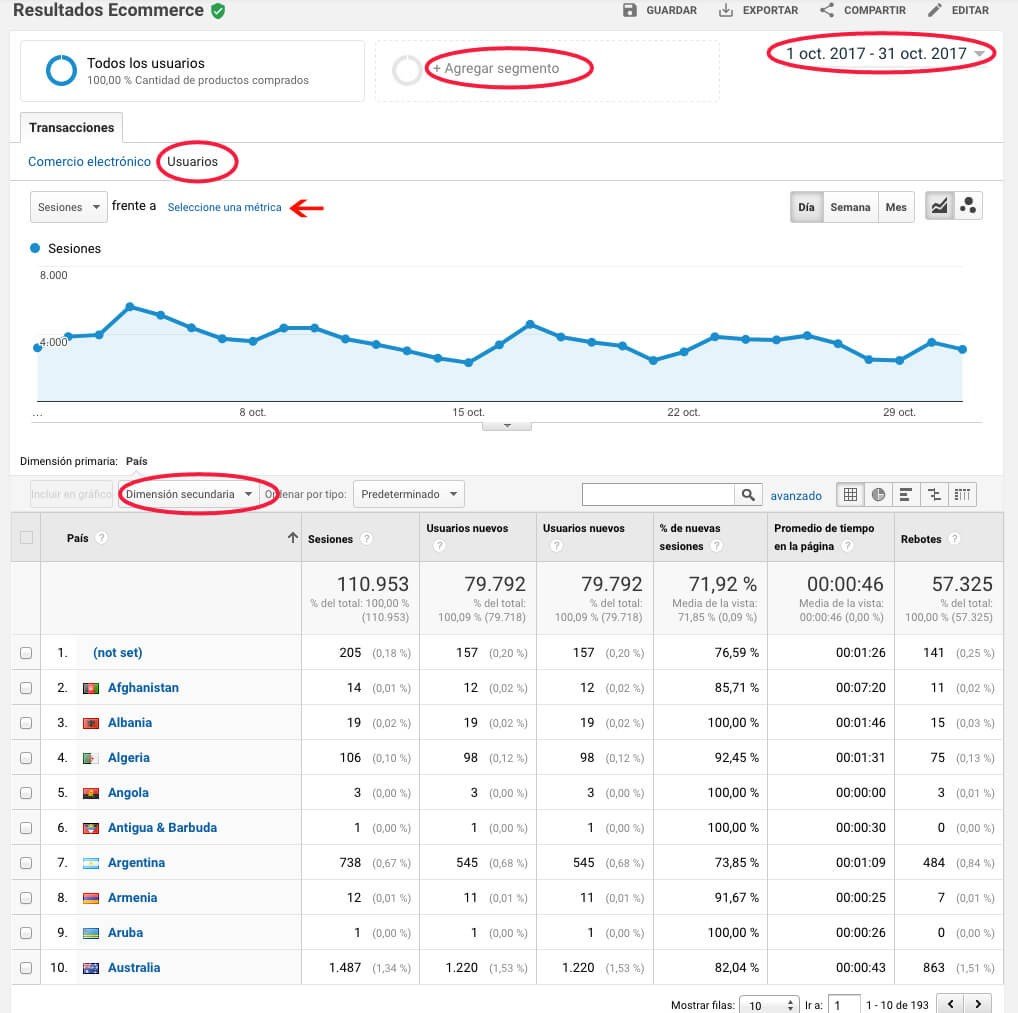
Siguiendo con el ejemplo comentado anteriormente, los datos que nos reportaría para el tipo de informe explorador es el siguiente:
Como vemos en el informe en los recuadros señalados, podemos cambiar o combinar datos:
- Fecha: te permite seleccionar el período que quieres analizar.
- Añadir un segmento: en caso de que desees focalizar aún más los datos.
- En la parte superior, observamos señalado “Usuarios”, en este caso vemos las métricas de usuarios establecidas en el ejemplo comentado. Para ver las métricas de “comercio electrónico”, solo tendríamos que hacer clic sobre la pestaña.
- En la gráfica superior, podemos combinar las sesiones con otra de las métricas de usuarios establecidas en el ejemplo.
- Finalmente, nos aparece la dimensión primaria que podemos combinarla con dimensiones secundarias.
Finalmente, puedes compartir tu informe con otro usuario introduciendo su e-mail, siempre y cuando tenga acceso a la propiedad y puedes guardar y exportar el informe en excel, csv, hoja de cálculo de google o pdf para trabajar de la forma más cómoda posible.
¡Y ahora es vuestro turno! ¿Os animáis a crear un informe personalizado en Google Analytics?


