
Saca el máximo partido a Google Data Studio en 10 pasos
Data Studio es un ejemplo más de cómo, desde la compañía de Mountain View, suelen adelantarse al resto del mundo. Y para bien o para mal, han democratizado la posibilidad para visualizar y analizar datos para tomar mejores decisiones en la empresa.
Google Data Studio fue lanzado a principios de 2016, dentro de la Google Analytics Suite 360, y es una herramienta gratuita que te permite crear gráficos bastante completos a partir de múltiples fuentes de datos.
Como muchas otras herramientas de Google, tiene algunas limitaciones (falta de personalización, a veces de rendimiento, no hay soporte oficial…), pero es una alternativa muy válida para las tareas mencionadas.
Para analizar los datos necesitaremos vincular o crear una o varias fuentes de datos y para ello Data Studio ofrece conectores para AdWords, Google Analytics, Google Sheets, BigQuery, Search Console, entre otros. Aunque también existen conectores de la comunidad que te permiten usar como input datos de otros proveedores.
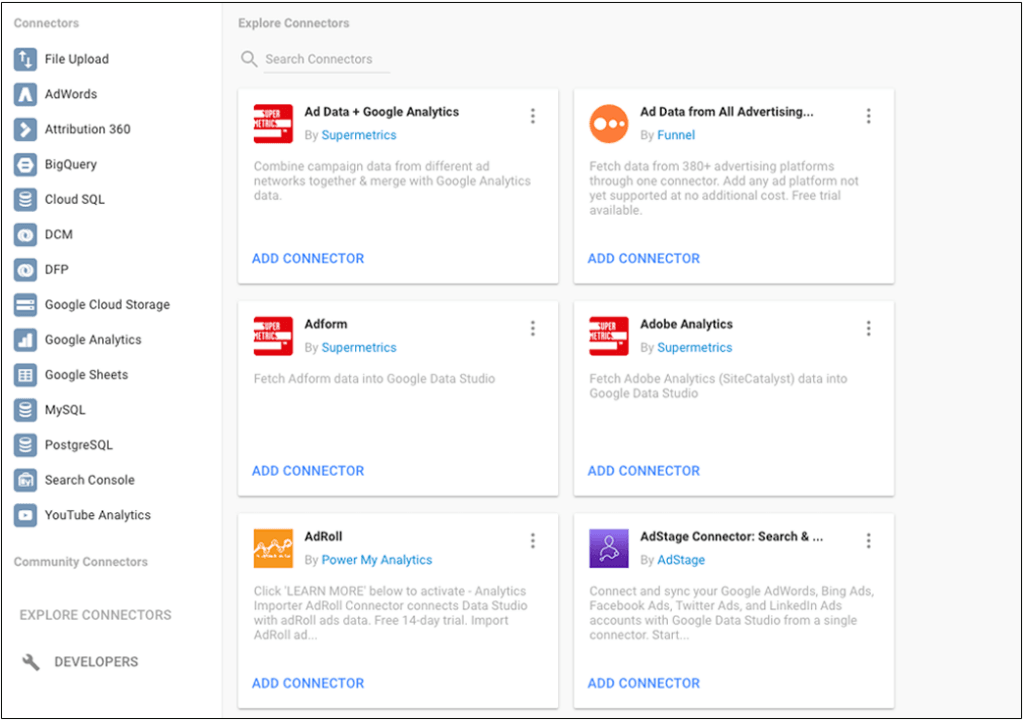
Además, existe una comunidad de usuarios de Data Studio, donde se pueden buscar dudas ya resueltas o proponer nuevos temas para obtener ayuda.
Ejemplo de reports de Google Data Studio
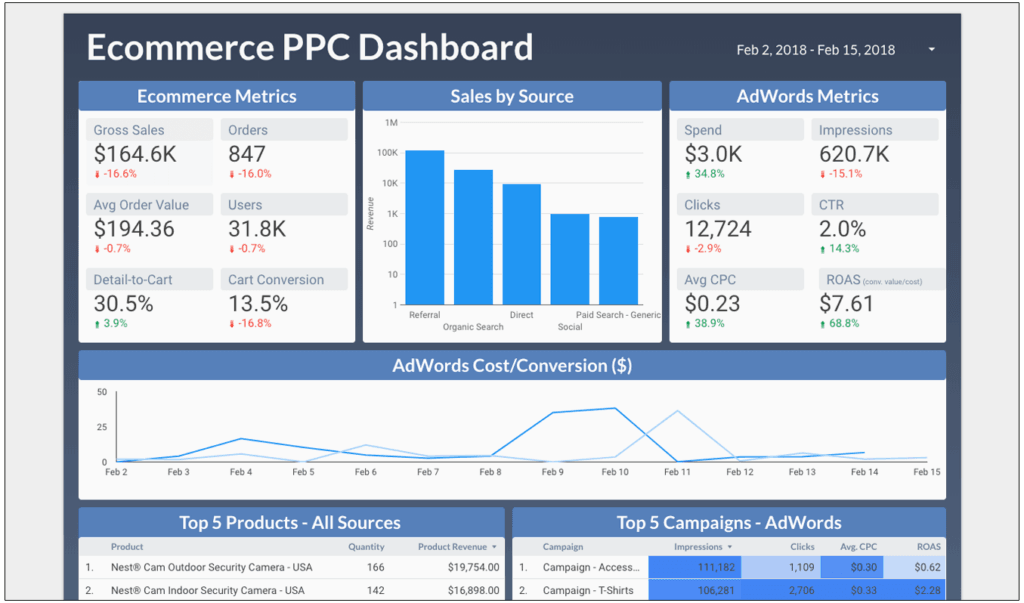
Aquí 2 ejemplos de report a partir de las plantillas disponibles al crear un nuevo dashboard.
Primero, para campañas de PPC de un ecommerce:
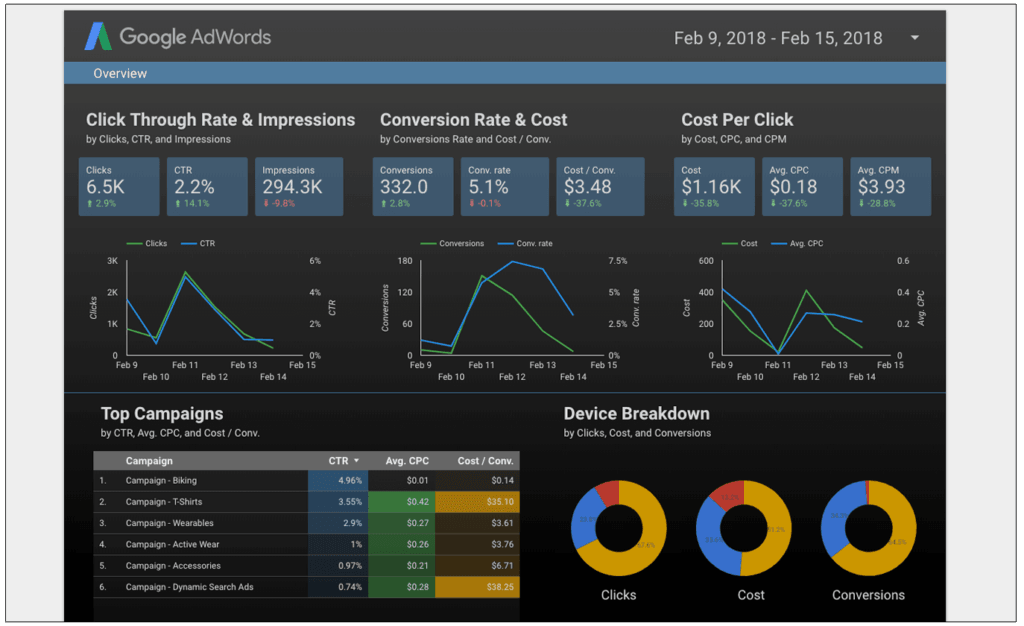
Y segundo, para campañas específicas de AdWords:
Saca el máximo partido a Google Data Studio en 10 pasos
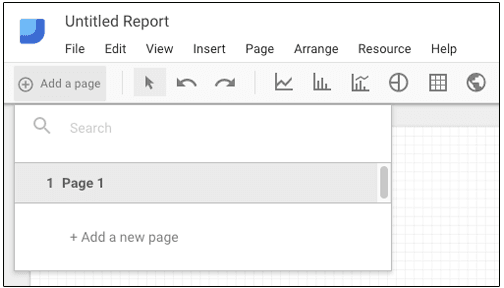
1. Creación de páginas de Data Studio
He visto muchos informes en los que toda la información se muestra en una única página. Esto puede ser suficiente para reportes en los que haya pocos datos. Pero para casos en los que tengamos un número de gráficos mayor, es más eficiente trabajar a nivel de páginas, mostrando en cada una un país diferente, una línea de productos diferente o cualquier otra separación que se nos ocurra.
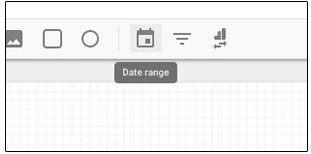
2. Selector de fechas
Una vez tenemos las páginas creadas, deberíamos añadir un selector de fechas a nuestro informe para así poder elegir el período de tiempo que queremos analizar de manera más ágil.
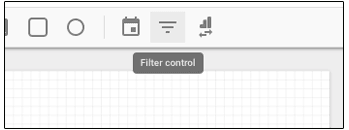
3. Filtros de control
Mediante los filtros de control podremos elegir dimensiones para actuar como filtro en nuestros informes. Por ejemplo, si estamos analizando campañas de AdWords, podríamos añadir un filtro para la dimensión Dispositivo y así tener un desplegable para mostrar datos de móvil, sobremesa y/o tablet, según nos interese.
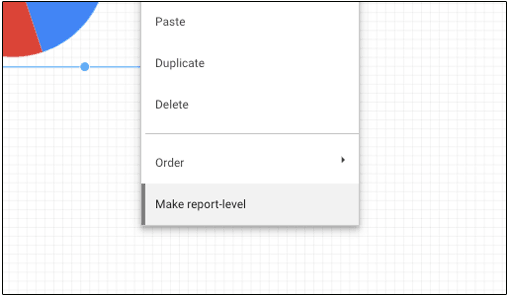
4. Nivel de informe
Si estamos trabajando con informes de más de una página, otra opción muy útil es hacer clic con el botón derecho en el selector de fechas y marcarlo a nivel de informe. Así, tendremos este widget en común para todas las páginas, sin tener que añadirlo manualmente en cada una de las páginas. Esto también es aplicable a los gráficos y otros widgets.
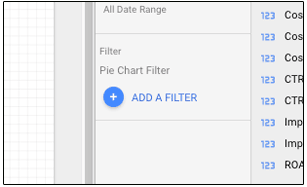
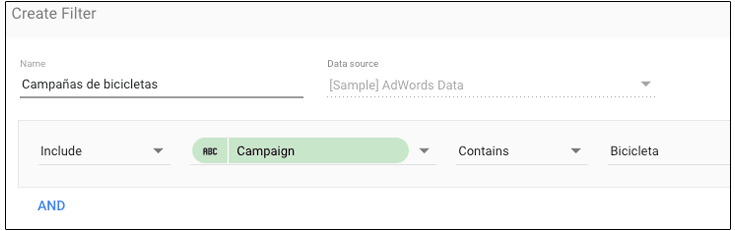
5. Filtros en Google Data Studio
Otra posibilidad, una de las más provechosas de Google Data Studio, es la opción de filtrar con la que incluiremos o excluiremos dimensiones o métricas cumpliendo una o varias condiciones. Por ejemplo, para un gráfico específico podremos elegir que nos muestre exclusivamente datos de las Campañas que contengan “bicicletas”.
6. Métricas personalizadas en Data Studio
A la hora de elegir una determinada métrica para un gráfico tenemos la posibilidad también de crear una nueva.
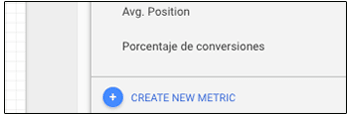
Dentro de un análisis de campañas de AdWords, podríamos crear, por ejemplo, una nueva métrica llamada Clics necesarios, resultado de dividir Clics entre Conversiones. Y así tendríamos una nueva métrica con el valor medio de clics necesarios para obtener una conversión.

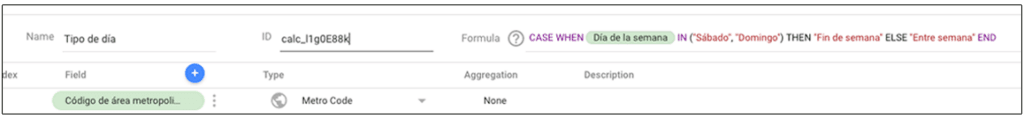
7. Dimensiones personalizadas en Google Data Studio
Con un comportamiento análogo al de las métricas personalizadas, podemos usar las dimensiones personalizadas para crear nuevas variables, esta vez con funciones de agregación. Aquí una lista de las funciones reconocidas por Google.
Por ejemplo, podríamos crear una dimensión personalizada para mostrar métricas diferenciadas según se trate de días entre semana o de fin de semana:
8. Fila resumen
En los gráficos de tipo tabla, tenemos la opción de marcar esta casilla dentro de los ajustes de datos, editando las propiedades de la tabla.
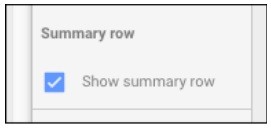
Visualizando una fila al final de la tabla que nos muestra la agregación o la media de nuestras métricas, según corresponda.
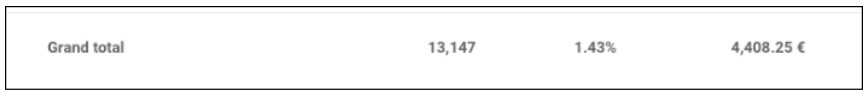
De esta manera nos resultará mucho más fácil comprobar nuestros datos y podremos tener una idea más global y rápida de nuestros datos.
9. Agrupación de objetos
Existen múltiples razones para agrupar objetos dentro de Data Studio, pero quizás la más práctica sea la de poder aplicar filtros a unos determinados gráficos dentro de la misma página.
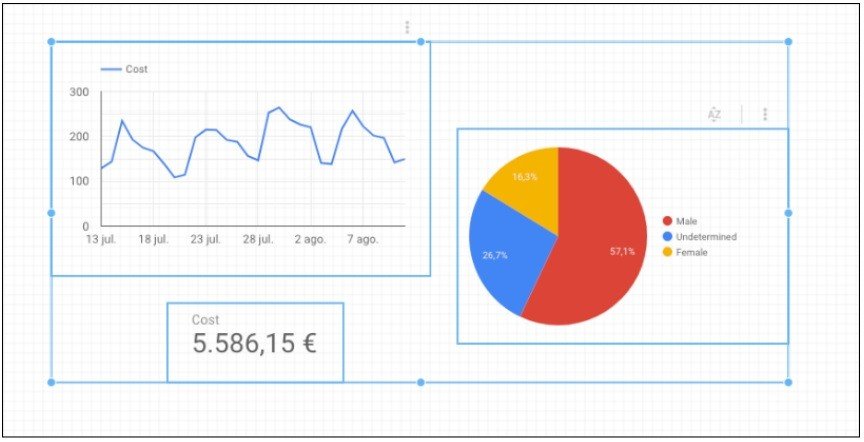
Simplemente tendremos que seleccionar los objetos que queremos agrupar y hacer clic con el botón derecho para elegir Grupo. Y con los gráficos agrupados, ya podremos aplicar los filtros a unos objetos específicos.
Si quisiéramos deshacer el grupo, simplemente marcaríamos la opción de Deshacer grupo con el clic derecho también y volveríamos a tener los gráficos de manera individual.
10. Atajos de teclado
De la misma manera que en otras herramientas o aplicaciones, nos puede resultar muy útil memorizar unos atajos de teclados para agilizar aquellas acciones más habituales.
Aquí una lista de los atajos de teclado para Google Data Studio:
- Ctrl + C → Copiar
- Ctrl + V → Pegar
- Ctrl + Z → Deshacer
- Ctrl + D → Duplicar
- Ctrl + A → Seleccionar todo
- Ctrl + G → Agrupar
- Ctrl + Shift + G → Deshacer grupo
- Ctrl + Shift + E → Actualizar datos
- Ctrl + Shift + ↑ → Traer al frente
- Ctrl + Shift + ↓ → Enviar al fondo
Y tú, ¿utilizas Google Data Studio? ¿Qué uso le das? ¿Conoces algún truco para analizar mejor las campañas?