
Conoce el nuevo Editor de Informes de AdWords
Hoy traemos una novedad con la que todos los account managers veníamos soñando desde hace tiempo. Para que veas que Alphabet no es la única novedad de Google, AdWords nos sorprende con herramienta de reporting propia que pone en bandeja a las agencias de AdWords el reporting personalizado para clientes exigentes. La elaboración de informes puede ser una auténtica pesadilla cuando las necesidades del cliente no responden a los estándares. Los informes básicos se quedan cortos para las agencias de AdWords y los personalizados requieren una inversión de tiempo exagerada para el beneficio que suponen. Ante este escenario, el todopoderoso Google acaba de poner su miguita de pan en el camino de la conciliación entre informes y gestores de cuentas con esta nueva herramienta que permite un reporting rápido y eficaz (si sabes lo que quieres). Olvídate de Pivot Tables y Excels que “no responden” y sumérgete en esta experiencia única con Digital Menta ¡Welcome to the new Report Editor! Hace menos de una semana que llegaba la noticia a nuestras pantallas, y todavía estamos que no nos lo creemos. AdWords lanza una nueva herramienta de reporting y Digital Menta tiene el honor de ser una de las primeras agencias de AdWords en probarla ¡qué orgullo y satisfacción! Eso sí, sólo la hemos avistado en una de nuestras cuentas, por el momento… Al parecer, como ya es costumbre con las nuevas funcionalidades, la activación será paulatina y todas las cuentas tendrán acceso al Editor de Informes de AdWords en unos meses.
Así funciona el Editor de Informes de AdWords
Niveles de trabajo
Por el momento nosotros la hemos encontrado a nivel de cuenta, no sabemos si se desarrollará también a nivel de MCC. Si los Google-ingenieros no lo han pensado desde aquí hacemos un llamamiento público: sería muy interesante para ver comportamientos opuestos en cuentas que pueden competir, o tendencias de mercado, entre otras cosas.
Sala de operaciones
Para acceder al Report Editor sólo tenemos que entrar en nuestra pestaña habitual de informes, donde a primera vista ya notaremos un aspecto un tanto diferente.
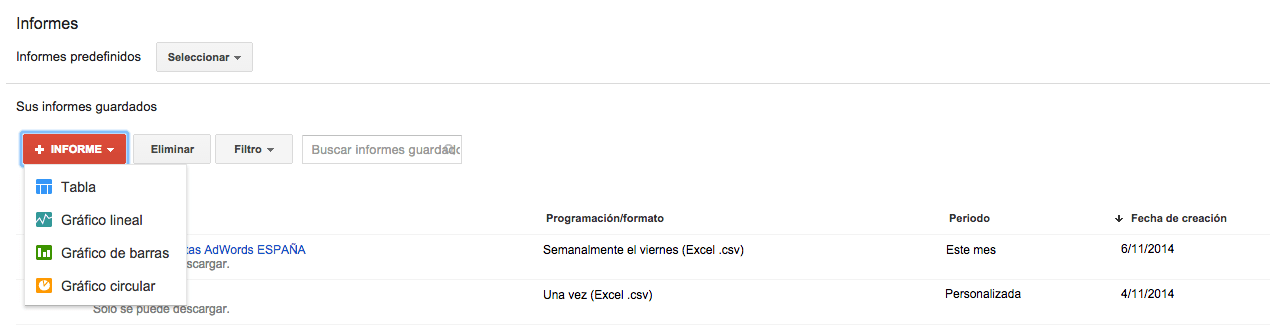
El nuevo Editor de Informes sustituye a la herramienta de informes habitual
Si pulsamos el botón para crear un informe nuevo, aparece un desplegable para seleccionar el tipo de informe que queremos. Veamos un ejemplo con un Informe tipo Tabla:
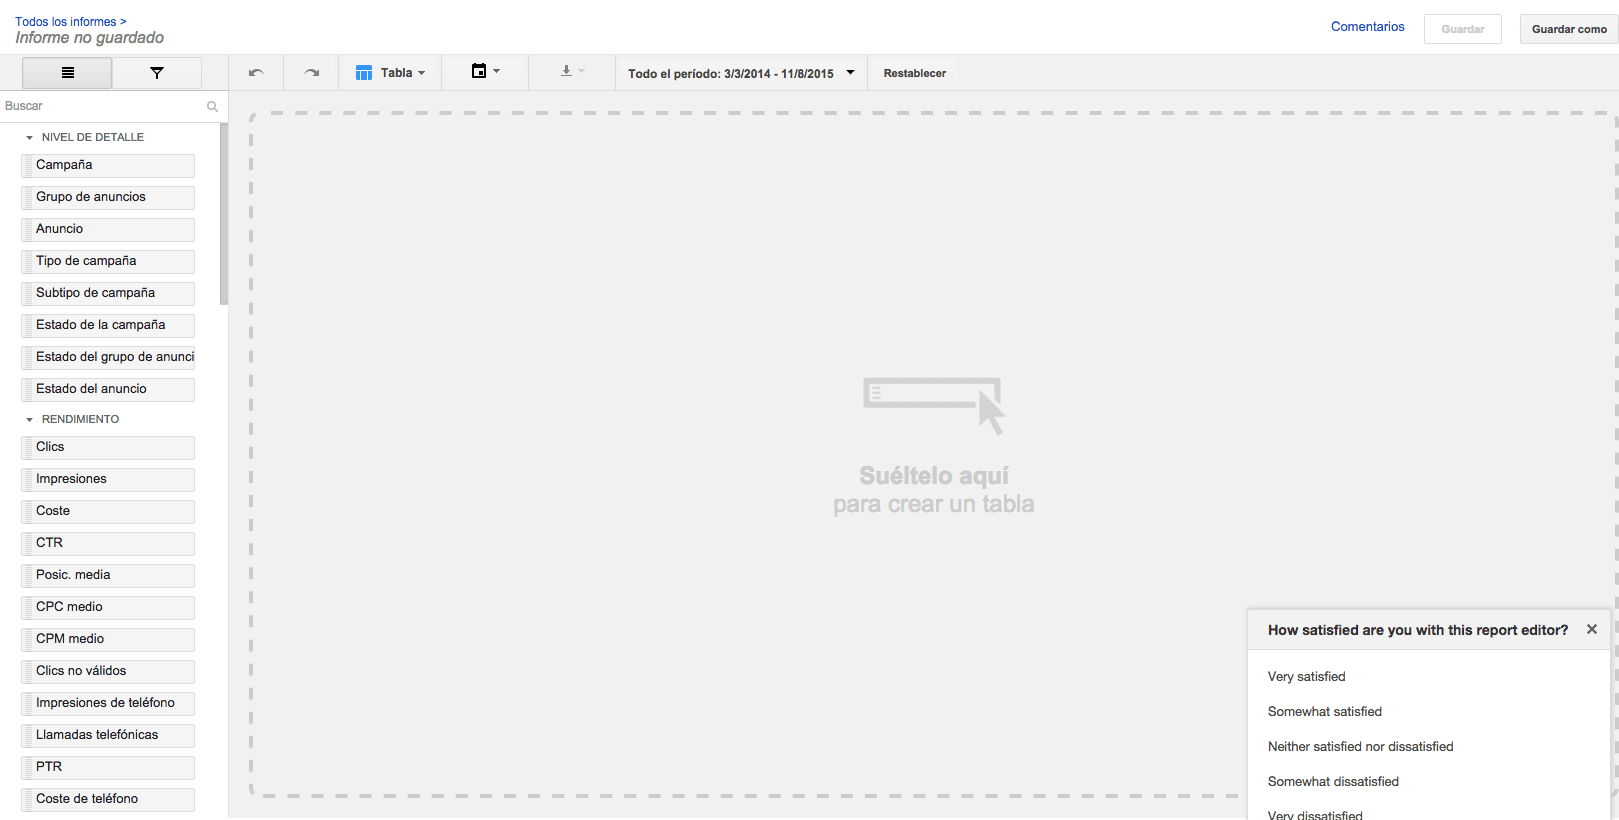
Sobre este panel podemos arrastrar las métricas y datos que queremos mostrar
Como veis, se trata de una sencilla herramienta “drag and drop”, podemos arrastrar el nivel de detalle y las métricas que necesitemos. También tenéis filtros para seleccionar sólo las campañas que os interesen. Mirad como queda:

Puedes usar los filtros para seleccionar las campañas que quieras ver en tu informe
Aquí si que veo un problema, tras seleccionar las métricas y arrastrarlas a la tabla, no hay una fila de totales. Es decir, nunca podemos ver un total agregado de los datos que tenemos en la misma vista que el desglose de campañas. No es grave pero nos obliga a sacar dos informes por separado para estos datos, y a trabajarlos fuera 🙁 Esperemos que esto nos lo solucionen pronto. Si alguno de vosotros tiene ya la herramienta en su cuenta y sabe cómo hacerlo, que se manifieste! Por aquí todavía estamos algo verdes  . Y llega el momento de descargar el informe. Podemos guardarlo para ejecutarlo alguna otra vez o descargarlo sin guardarlo.
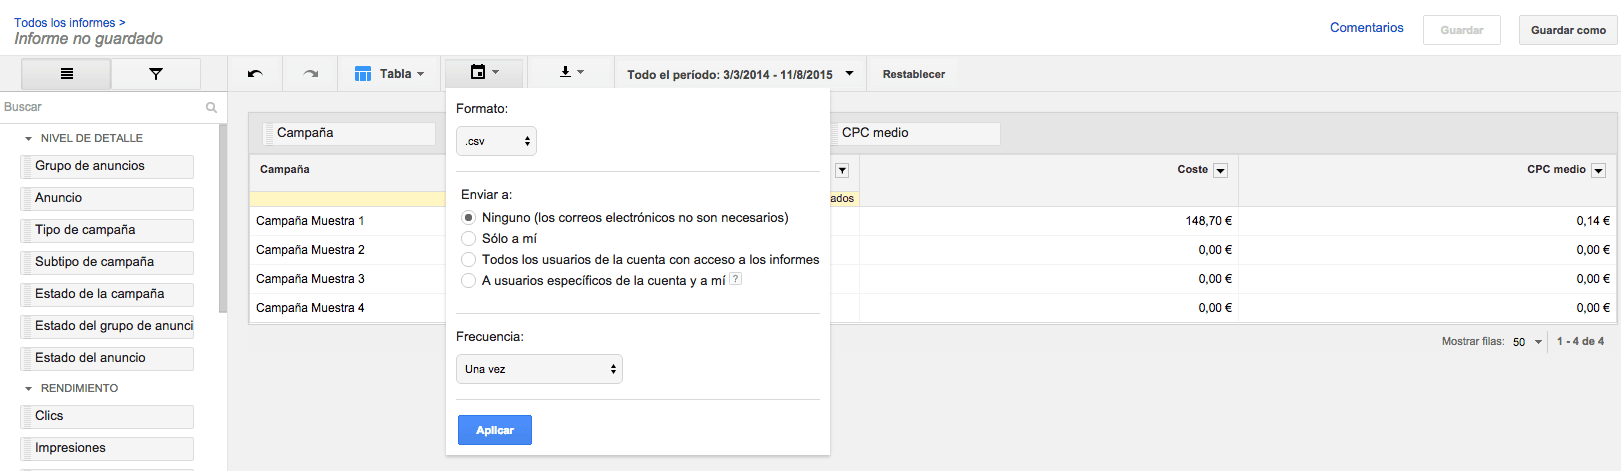
Descarga los informes y guárdalos o prográmalos para que se envíen periódicamente
Probemos ahora con un gráfico lineal. En este ejemplo comparamos el coste de una campaña y sus incrementos en CPC. Podemos hacer las comparativas que queramos y seleccionar como queremos ver los datos (en azul): diariamente, semanalmente, mensualmente, trimestralmente o anualmente.
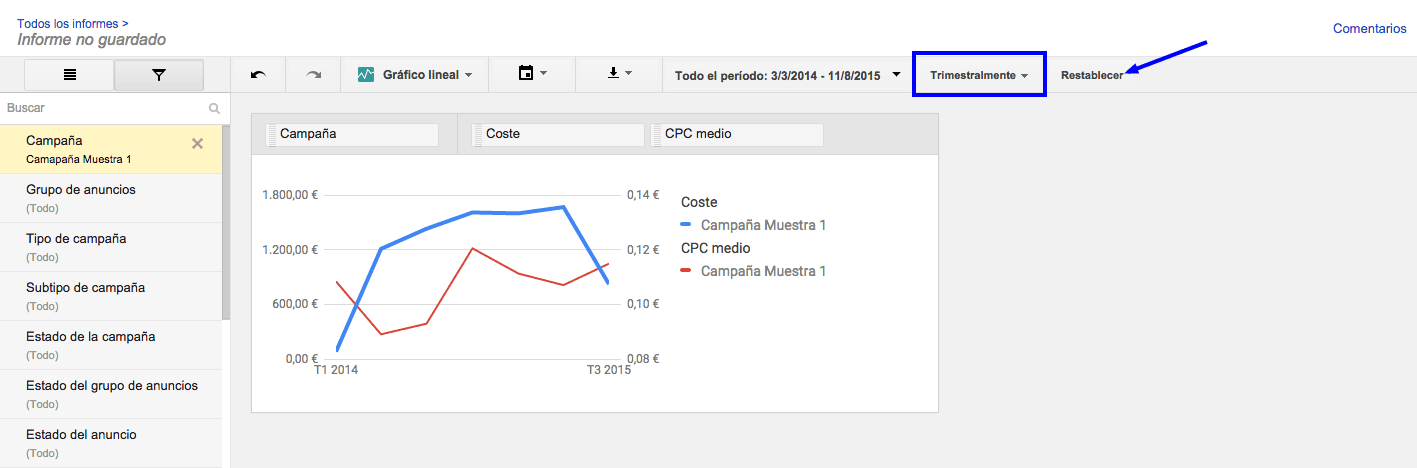
Haz gráficos lineales para ver tendencias y variaciones en el valor de las métricas
Vamos con un gráfico de barras. La configuración es la misma, sólo hay que arrastrar los valores a nuestra mesa de operaciones. Los gráficos de barras también pueden ser muy útiles para representar tendencias. Si queremos cambiar los criterios, sólo hay que sacarlos y deslizar los que queramos ver:
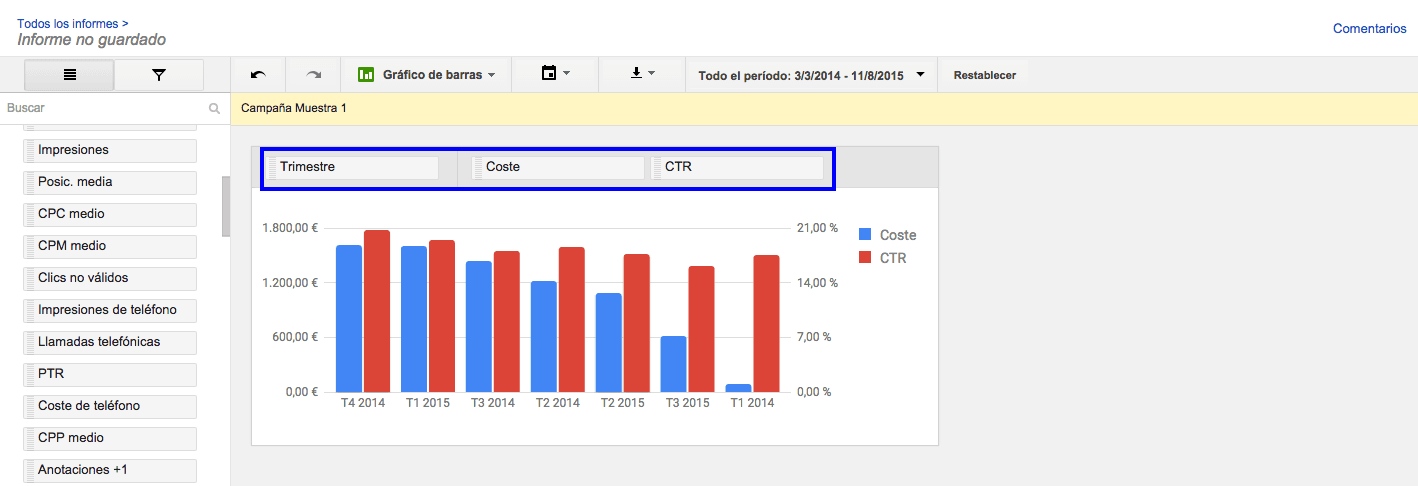
Construye gráficos de barras para ver tendencias y comparar métricas en tus campañas
¿Y si queremos ver valores en proporción a un total? Imaginemos que queremos saber dónde van nuestros clics, ¿nuestras campañas obtienen más clics en la red de búsqueda o en páginas de partners? Veamos las tartas de datos.
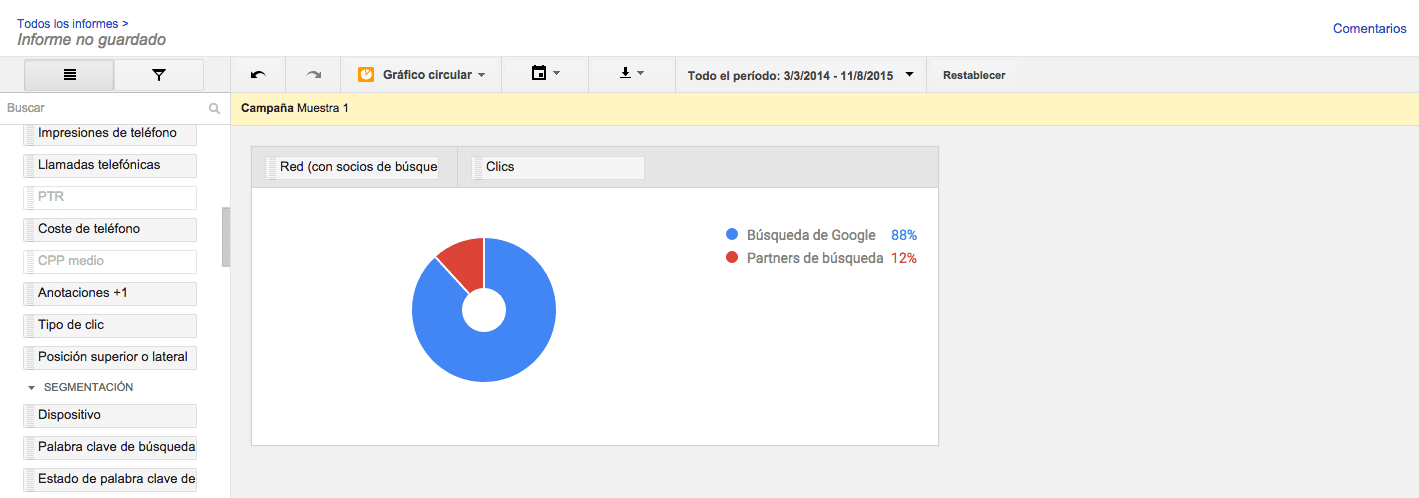
En este gráfico veremos proporciones sobre un total de datos
Con esto terminamos nuestra pequeña aventura. Si tú también has probado el Editor de Informes de AdWords, cuén-ta-nos-cómo te ha ido-si has conocido la felicidaaaad… Próximamente en las mejores cuentas