
Utilizar PageSpeed Insights para mejorar la calidad de una Landing Page
Los usuarios cada vez son más exigentes, por ello debemos ofrecer experiencias rápidas y satisfactorias. Por ello, es importante optimizar el tiempo de carga de nuestra landing page. Y debemos ser más exigentes con nuestro site en dispositivos móviles.
Según estudios recientes, el tiempo medio de carga de una página en un dispositivo móvil es de 22 segundos. Tendiendo en cuenta que más del 50% de los visitantes de un sitio web en móvil abandona una web que tarde más de 3 segundos en cargarse, esto es un problema a considerar. Por tanto nuestro site, debe convencer el usuario dentro de ese margen y no hacerle esperar.
Incluimos a continuación una gráfica que representa la probabilidad de abandono de una página en dispositivos móviles en función del tiempo de carga del site.
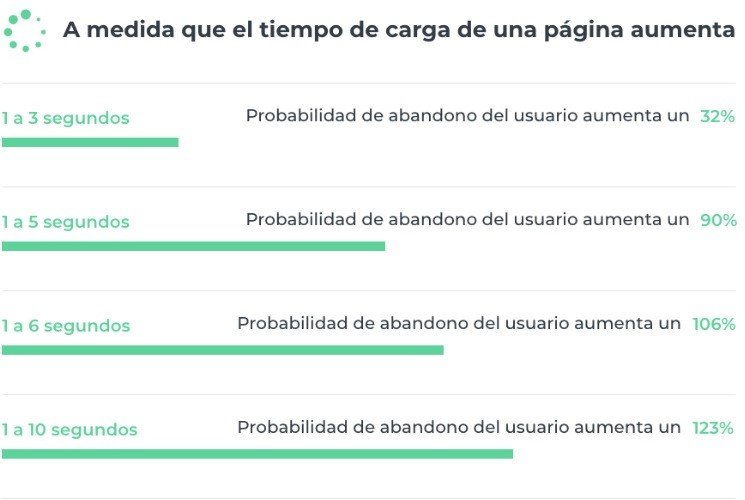
Fuente: Estudio de Google/SOASTA
No es ningún secreto que los compradores de un ecommerce o los visitantes de cualquier web cada vez exigen experiencias más rápidas. Si estas experiencias les resultan lentas o complicadas pueden abandonar el site o el carrito de compra.
A continuación, os presentaremos la herramienta de PageSpeed Insights y haremos énfasis en los puntos básicos a tener en cuenta para mejorar esta experiencia de los usuarios en nuestra landing page.
Ya hemos hablado en otros posts sobre cómo la experiencia de uso de la landing page de un anuncio en Google Ads afectaba a su quality score y, por tanto, a su posición media. En este post, por ejemplo, dábamos un pequeño truco para aumentar la relevancia de la landing page.
¿Cómo se utiliza y para qué sirve Google PageSpeed Insights?
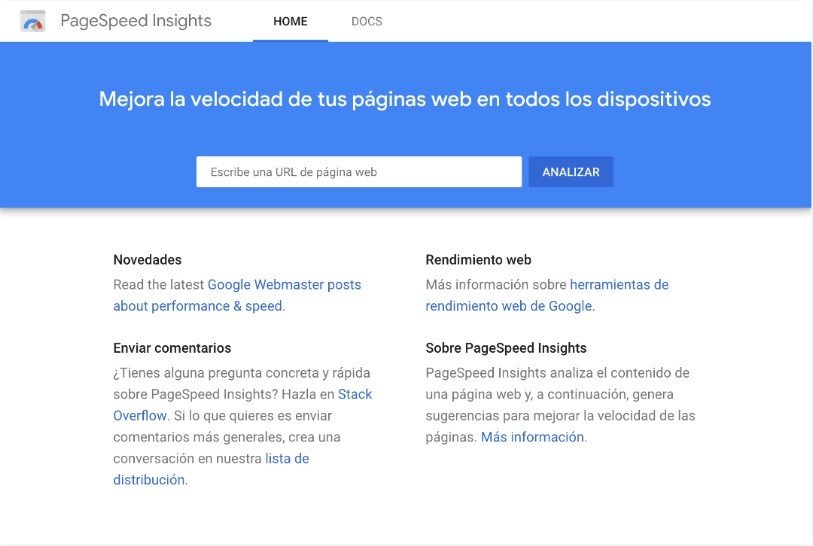
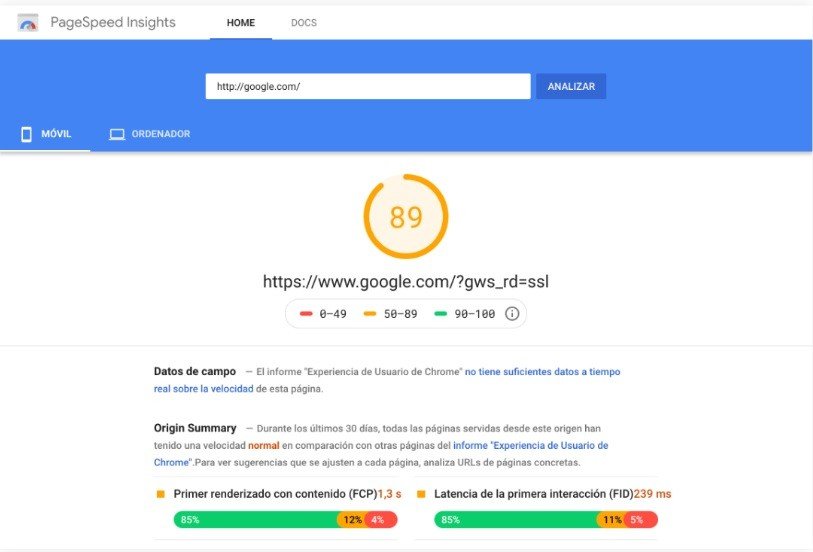
PageSpeed es una herramienta de Google Developers que analiza el contenido de un sitio web, mide aspectos relacionados con el tiempo de carga y la experiencia de uso de una página web y, en base a los resultados de esa medición, nos devuelve una puntuación (sobre 100) y unos consejos para su mejora.
La herramienta nos proporciona dos mediciones diferentes: para móvil y para ordenador. Diferentes baremos, diferentes mediciones y, por tanto, diferentes resultados.
Es muy sencilla de utilizar:
-
- Escribir la URL de la página que se desea medir
- Acceder a PageSpeed Insigths
- Click en ANALIZAR y esperar a los resultados
¿Cómo interpretar los resultados de un análisis de PageSpeed Insights?
En primer lugar, veremos que los resultados son diferentes para móvil y para ordenador. Utiliza criterios diferentes, así que el análisis es diferente.
Los diferentes factores medidos pueden obtener estas 3 calificaciones:
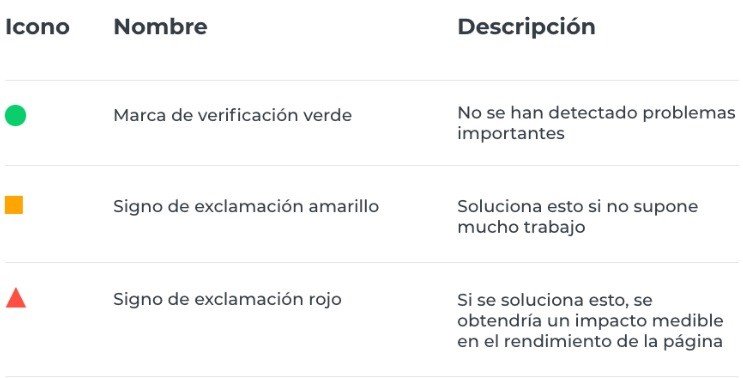
Por tanto podemos observar los diferentes tipos de calificaciones:
- Reglas aprobadas.
- Incumplido con impacto medio. Elementos que puedes plantearte corregir. Solucionarlo no supondrá una gran diferencia.
- Incumplido y tiene un impacto importante negativo. Elementos que debes corregir. Solucionarlo resultaría significativo.
Métricas de velocidad en PageSpeed Insights
La herramienta mide aspectos relacionados con el tiempo de carga de la página. La verdad es que es bastante exigente con la velocidad de carga, sobre todo en móviles.
Según todos los aspectos analizados por la aplicación y su calificación, obtendrás una nota (sobre 100).
Estas son algunas de las métricas de análisis que mide esta herramienta:
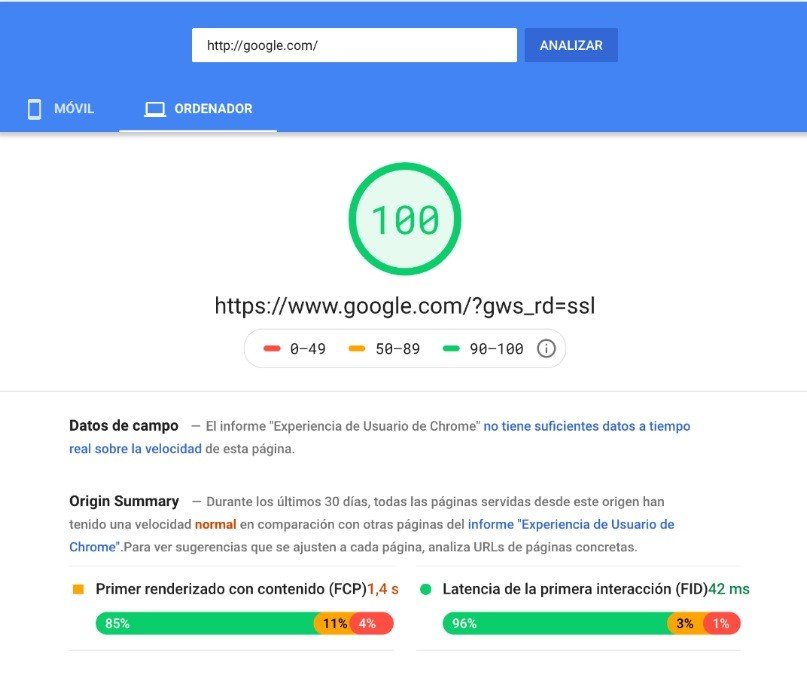
- Datos de campo:
Nos ofrece una primera estimación del tiempo de carga de la web durante los últimos 30 días en comparación al rendimiento de otras webs que se incluyen en el informe de Chrome User Experience Report.
Se tienen en cuenta para este apartado del análisis el Primer Renderizado de Contenido (FCP), el tiempo que tarda la página en mostrar la primer imagen o texto del sitio web y la Latencia de la Primera Interacción (FID). En resumen, nos muestra el el tiempo de carga total hasta que nuestro usuario puede comenzar a interactuar con nuestro contenido o elementos dentro del sitio web.
Los resultados son mostrados en una escala de colores por la herramienta y representa cómo se ha cargado la web para los diferentes usuarios de los que se han registrado datos en los últimos 30 días en el informe de Chrome User Experience Report.
Nos muestra la media de todos los FCP y FID en la parte superior. Si tu página se encuentra dentro de la media comparado con el resto de páginas, tu puntuación saldrá en naranja. Si está por encima saldrá en verde y significará que es más rápida que la media, y si está por debajo aparecerá en rojo.
Si el informe de Chrome User Experience Report no tiene suficientes datos en tiempo real de la velocidad de la web, este campo aparecerá vacío.
- Datos de experimento:
La herramienta simula un test de carga en un dispositivo móvil con conexión 3G y analiza una serie de métricas que están vinculadas a diferentes momentos de carga de un site, unidas a la posibilidad de interacción de los usuarios a lo largo de estas. Las métricas son las siguientes:
Primer Renderizado de Contenido o FCP. Se trata del tiempo que tarda el sitio web en cargar la primera imagen o contenido.
Primer Renderizado Significativo. Se trata del tiempo que tarda el sitio web en cargar el contenido principal con imágenes y texto.
Índice de velocidad. Se trata de lo rápido que se rellenan los blancos de los contenidos.
Primer Tiempo Inactivo e la CPU. Se trata del tiempo que pasa hasta que los principales componentes o elementos de la web son mínimamente interactivos.
Tiempo hasta que está interactiva. Se trata del tiempo que debe pasar hasta que la página es interactiva al 100%.
Latencia de Entrada Estimada o FID. Se trata del tiempo que tardan los componentes en responder cuando el usuario interactúa con ellos durante los 5 segundos de carga. Con valores mayores a 50ms, los usuarios tendrán una percepción de que el sitio web tarda en cargarse.
- Oportunidades:
En esta sección, muestra las recomendaciones que sugiere la herramienta para optimizar las métricas de rendimiento de la web. Se incluye una estimación de la rapidez que se ganaría si dichas mejoras fueran implementadas.
Estos son algunos de los ejemplos:
-
- Posponer la carga de imágenes que no aparecen en pantalla
- Reducir tiempos de respuesta del servidor (TTFB)
- Eliminar recursos que bloqueen el renderizado
- Usar un tamaño adecuado de las imágenes
- Evitar redirecciones de página
- Publicar imágenes con formatos de próxima generación
- Posponer la carga de archivos CSS
- Diagnóstico:
La herramienta también nos aporta algunas recomendaciones más técnicas que están pensadas principalmente para desarrolladores. Alguna de las sugerencias que se nos proponen incluye reducir el número de nodos de los que se compone la web o el tiempo de ejecución de JS.
- Auditorías aprobadas:
Establece un resumen de los tests que ha superado el sitio web correctamente.
Todo esto es especialmente interesante, porque afecta a la usabilidad de la página, leer este artículo sobre “Reducir el tamaño del contenido de la mitad superior de la página”
¿Cómo utilizar PageSpeed Insights para mejorar la calidad de una Landing Page?
En un mundo en el que cada vez los usuarios reciben más información y disponen de menos tiempo para dedicar a esta, el tiempo de carga de una página web es esencial. Y en móvil es aún más relevante cuando sabemos que el uso de dispositivos móviles continúa en aumento en relación a otro tipo de dispositivos.
Por ello, la experiencia que proporciones a tus usuarios es esencial, y esto incluye la velocidad de carga de tu site. Si deseas conservar a los usuarios en tu web y que no salgan rebotados debes prestar atención a todos los detalles mencionados anteriormente y crear una web más rápida, que sea más amigable y proporcione mejor experiencia al usuario en general.
Y si estás utilizando esta página web como url de destino de un anuncio en AdWords, una mala usabilidad puede influir en el quality score de tu anuncio, bajar la posición media y empeorar los resultados de tu campaña.
Así pues, si tienes entre 3 y 10 segundos para convencer a tu cliente potencial, sé plenamente consciente de que cada segundo cuenta. Conseguir una mejor valoración en PageSpeed significa una mejor respuesta al usuario.
¿Cómo podemos mejorar nuestra puntuación y por tanto la velocidad de carga?
Mostramos a continuación algunas de las recomendaciones que nos permitirán mejorar la puntuación de Google PageSpeed Insights:
- Aplazar carga de imágenes, vídeos o contenido multimedia que no es visible en un primer momento.
Con una carga progresiva de los diferentes elementos que hemos mencionado con anterioridad conseguimos reducir el tiempo de carga inicial, ya que se van visualizando los elementos en función de la zona de la pantalla en la que se encuentra el usuario y que es necesaria para que este interactúe con el sitio web. Con Tecnología Lazy Load podemos conseguirlo.
- Aplazar o suprimir recursos que bloqueen la carga de la web.
- Evitar redirecciones innecesarias. Esto también puede reducir el tiempo de carga.
- Eliminar CSS que no se utilice. Suprimir todas las líneas de código con que se usen, también mejorará la velocidad de nuestro site. El CSS que no se usa aparece reflejado en la sección de Coverage de la consola de Chrome.
- Formatos de imágenes de próxima generación, como JPEG 2000, JPEG XR o WebP.
Cualquiera de estos formatos se descargan con mayor rapidez que los formatos convencionales PNG o JPEG. El problema que presenta es que este tipo de formatos no son compatibles con todos los navegadores y será necesario ver su evolución para ver si finalmente nos conviene incluirlos en nuestros sitios web.
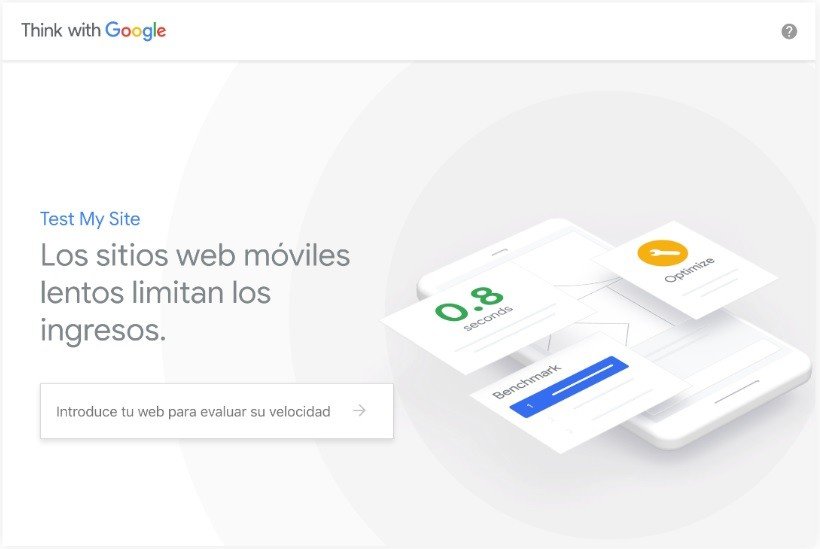
Otras herramientas: Google Test My Site
Otras herramientas que pueden ayudarnos a mejorar el tiempo de carga de nuestra página web, sobre todo en dispositivos móviles la herramienta de Google Test My Site mide la velocidad de todas las páginas de tu sitio web en función de diversos datos de todo el mundo y comparativa con otras empresas del sector recopilados en un Informe sobre la experiencia de usuario en Chrome (Chrome User Experience Report).
Utilizar Google PageSpeed Insights u otras herramientas no resolverá nada por sí mismo, ten en consideración que somos nosotros los que tenemos que llevar a cabo las acciones. Pero utilizarlo como guía, cumplir con sus sugerencias y obtener mejores valoraciones nos ayudará a llegar mejor y más rápido a nuestros usuarios.