
Introducción a Hotjar: analiza el comportamiento de tus usuarios
Cualquier buena estrategia de CRO (Conversion Rate Optimization) tiene que estar sustentada en métricas, mediciones, análisis y sus posteriores conclusiones. Para conseguir el máximo rendimiento de nuestro sitio web o landing page, debemos saber cómo se comportan nuestros usuarios y cómo interactúan con nuestro diseño.
Conocer el mapa de calor de tu sitio, como ejemplo de medición cualitativa, nos ayudará a aclarar algunas métricas cuantitativas importantes: tasa de rebote, tasa de conversión, tiempo de la sesión,… Conociendo a tu usuario puedes mejorar la usabilidad y aumentar la tasa de conversión. Hoy os traemos una pequeña introducción a Hotjar, una de las mejores herramientas para llevar a cabo estas mediciones cualitativas (y también otras cuantitativas).
¿Qué es Hotjar?
Como decimos, Hotjar es una gran herramienta para llevar a cabo estas mediciones cualitativas y cuantitativas. Y es que Hotjar es probablemente la herramienta lider en el mercado a la hora de entender como actúan los usuarios en nuestro sitio web y poder tomar decisiones estratégicas que se traduzcan en unos mejores resultados y ratios de conversión.
A continuación os describimos las 4 principales utilidades para análisis en esta introducción a Hotjar:
Mapas de calor (heatmaps) de Hotjar
Un mapa de calor es una representación gráfica de de la interacción de los usuarios en un sitio web. A modo de mapa y, a través de colores, se muestra la interactividad (promedio en algunos casos y absoluta en otros) que suponen los clicks, la acción de scroll y el movimiento del ratón (o el dedo). Nos sirve para saber dónde se centra la atención de nuestros usuarios, qué les genera interés y, sobre todo, qué les distrae del objetivo (la conversión).
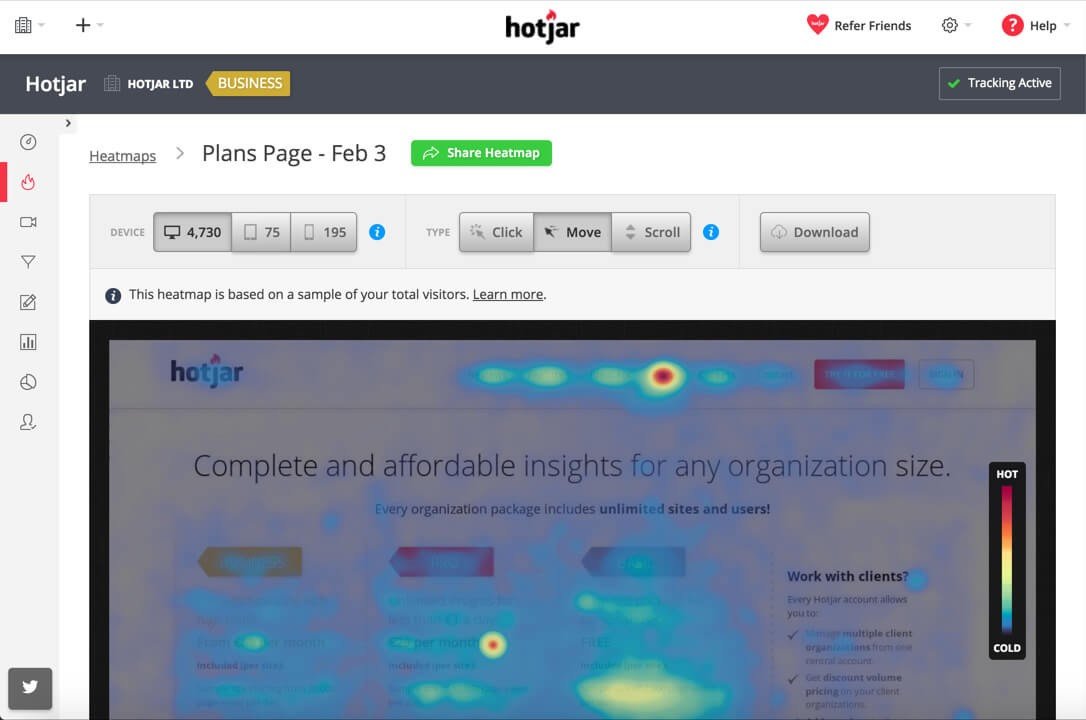
Pantallazo de un mapa de calor de Hotjar
En Hotjar, se pueden visualizar 3 tipos de mapas de calor o heatmaps que podemos filtrar para resolución desktop, tablet o mobile:
-
- Click: nos muestra todos los clicks en la página analizada. La cantidad de clicks registrados se muestran en una escala de colores desde el azul (menos clicks) hasta el rojo (mayor concentración). La métrica es absoluta, ya que los clicks es una medida contable. Sólo disponible para ordenadores (no dispositivos móviles), ya que existe el tipo “Tap” para móviles y tabletas.
- Scroll: este mapa de calor nos devolverá una métrica fundamental para nuestro planteamiento de UX/UI. Aquí podremos conocer hasta qué punto de nuestra landing page están desplazándose mediante scroll nuestros usuarios, en porcentajes. También podremos saber el tamaño promedio de sus pantallas (average fold), algo que es fundamental tener en cuenta en el proceso de diseño y en una estrategia de CRO.
- Move: aquí vemos, de una forma muy similar a los clicks, la posición del ratón en promedio. Es una forma de saber hacia donde dirigen los usuarios su mirada. Al compararlo con el mapa de clicks podemos averiguar si estamos dirigiendo correctamente al usuario y si le estamos convenciendo para hacer click.. ¿Merodean nuestro call to action y no hacen click? Al igual que el mapa de clicks, el de desplazamiento sólo está disponible para ordenadores (donde se usa un ratón que trackear)
Antes de lanzarte con un test AB, es importante que conozcas los puntos débiles de tu página.
Grabaciones (recordings) de sesiones con Hotjar
Una herramienta impresionante donde visualizar grabaciones en tiempo real de las sesiones de los usuarios. Aquí podremos visualizar videos grabados automáticamente por Hotjar de cada usuario que visita nuestra página.
Podremos ver el cursor del ratón, su recorrido, sus clicks y su scroll, todo ello en una grabación de tiempo real. Aquí puedes ver cuánto tiempo se detiene un usuario a leer los textos de tu página, cuánto le cuesta encontrar la información qué le gusta, cuánto le cuesta hacer click en un botón… Hacer click a un botón nunca es tan fácil cómo tu pensabas.
En los Recordings de Hotjar, el video sigue al usuario por todas las URLs que visite durante su sesión que tengan instalado el código de nuestro proyecto.
Además, Hotjar permite filtrar las grabaciones por tipo de dispositivo (móvil, ordenador, tablet), por navegador, por páginas visitadas, país, sistema operativo… Si tienes una tasa de conversión muy dispar entre los usuarios de Windows y Mac, aquí encontrarás la respuesta. Si tu tasa de rebote es alta en los móviles, las grabaciones también te darán conclusiones importantes.
También puedes hacer filtros más complejos para ver sólo aquellas grabaciones de las sesiones que acabaron en tu “thank you page”, o las que abandonaron en cierta URL,…
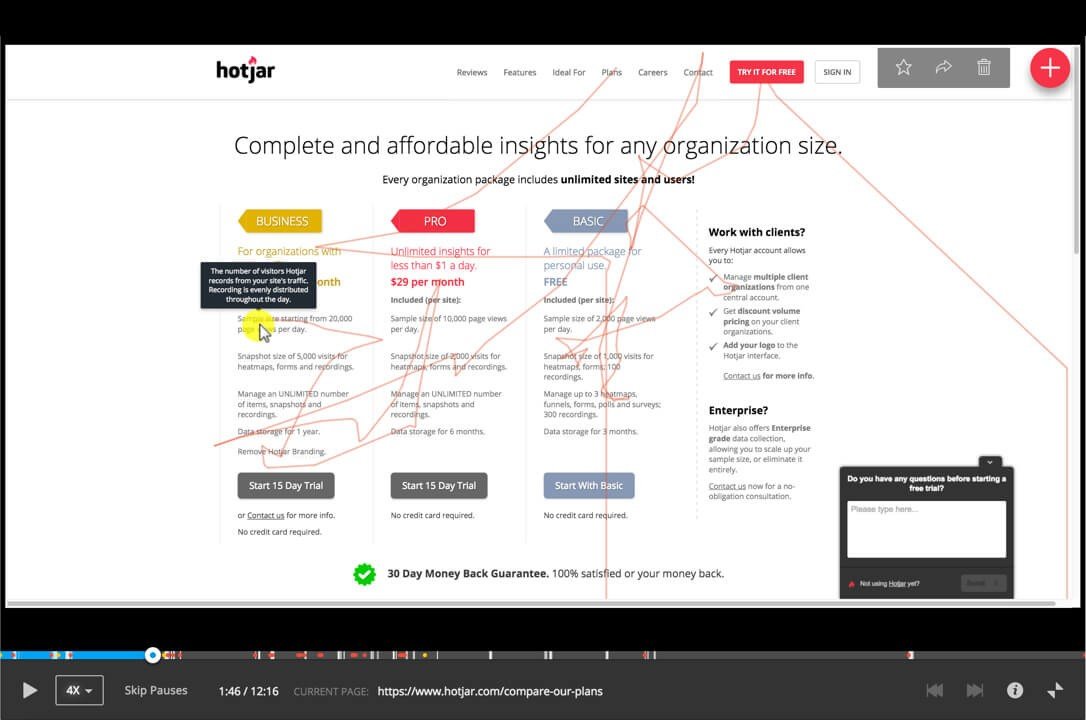
Así se ven las grabaciones de las sesiones en Hotjar
Es importante saber que la grabación se detendrá en cuanto el usuario salga a una URL donde no esté instalado nuestro código de Hotjar (por ejemplo, un TPV externo)
La versión Basic del registro de Hotjar permite hasta 100 grabaciones y puedes bloquear algunas IPs para evitar grabarte a ti mismo mientras testeas tu diseño 😉
Embudo de conversión (funnels) de Hotjar
Hotjar también permite medir las visitas a través de tu embudo de ventas. Es sencillo, funciona así:
- Configuras el funnel o embudo. Le das nombre y empiezas a añadir los pasos de tu proceso de conversión.
- Cuando empieces a tener resultados de mediciones, podrás ver las grabaciones de los usuarios que abandonaron en cada paso, las tasas de rebote y las de conversión.
Podrás descubrir en qué momento tus usuarios abandonan el proceso de compra y podrás tomar medidas al respecto. Esto debería ser parte fundamental de una estrategia de CRO.
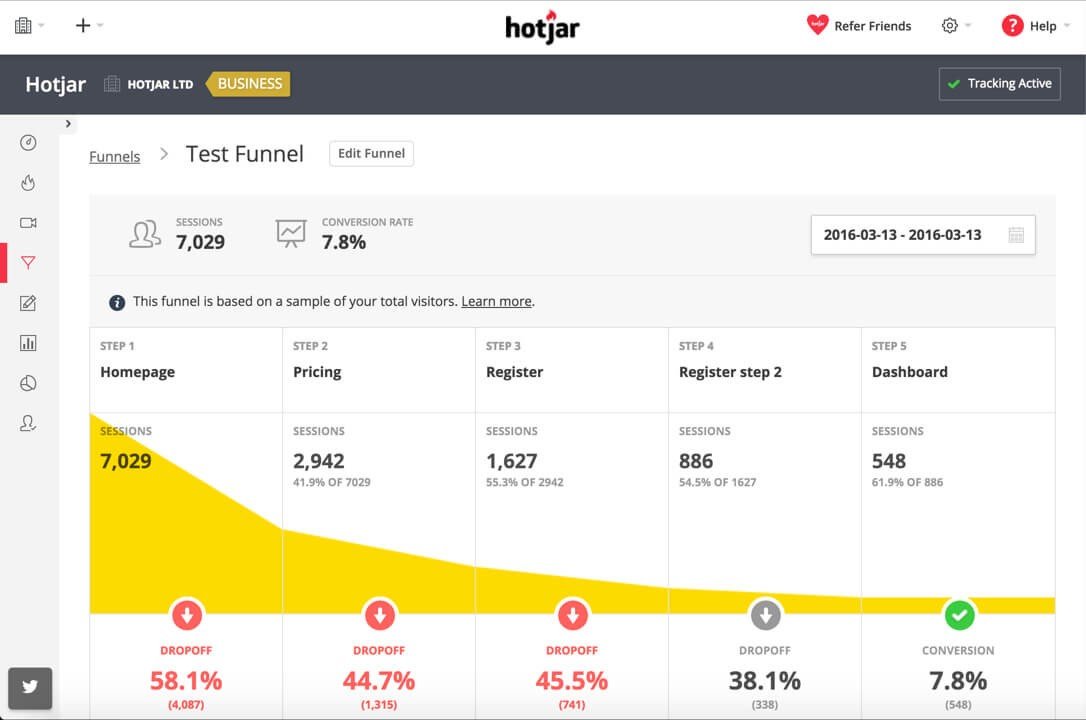
Pantallazo de un embudo de conversion de Hotjar
Medición de formularios (forms) con Hotjar
Esta herramienta nos ayuda con una medición más técnica y profunda: la interacción con los formularios de nuestra página. Hotjar nos permite medir, a través de su utilidad para formularios:
- Tiempo que pasan los usuarios en cada campo del formulario
- Sí, es genial.¡ Ahora ya puedes averiguar que campo de tu formulario le resulta más incómodo a tus usuarios!
- Y, además, se configura de una forma muy fácil. Indicas la URL de tu página donde se encuentran lo/s formulario/s que quieres analizar y la herramienta detecta todos los formularios que contiene y qué campos tiene cada formulario. Bravo por Hotjar.
Con la versión Basic puedes medir hasta 1000 sesiones y 3 formularios.
¿Cómo se configura Hotjar en un sitio web?
Muy fácil, creamos un nuevo proyecto (“Add new site”), configuramos la URL de inicio y Hotjar nos facilita un script en un trocito de código sencillo.
Copiamos y pegamos el código en todas las páginas y URLs que queremos trackear en Hotjar. ¡Ojo! En todas, para que no perdamos la pista de nuestros usuarios en algún momento crítico.
Y listo, ya nos podemos poner a configurar los mapas de calor y los embudos de conversión.
Podrás ser el experto en usabilidad más experto del mundo, pero conocer (no prever) el comportamiento de los usuarios en tu página te puede convertir en el experto en usabilidad con las conclusiones más acertadas y los argumentos más objetivos.
Hotjar es una herramienta perfecta para sacar las mejores conclusiones para una estrategia de Conversion Rate Optimization con éxito.