
Nueva función de AdWords: Resumen de la Red de Display
La interfaz de AdWords, ese conjunto de filas y columnas llenas de cantidades y porcentajes está continuamente cambiando, para mejor, claro. Poco a poco va incorporando novedades que la hacen más visual y usable. Si hace apenas unas semanas os hablábamos del nuevo Editor de Informes de AdWords, hoy vengo a hablaros de otra “novedad”, el Resumen de la Red de Display.
Ya os habréis dado cuenta de que he entrecomillado la palabra novedad, y es que, aunque esta funcionalidad tenga ya algún tiempo, todavía no está presente en todas las cuentas publicitarias. Este botón llamado “Resumen”, que poco a poco se irá incorporando a la totalidad de las cuentas de AdWords con campañas del tipo “Solo para la red de Display”, se encuentra situado dentro de la pestaña “Red de Display”.

Así es como se muestra la pestaña “Red de display” SIN el botón “Resumen”.

Así es como se muestra la pestaña “Red de display” CON el botón “Resumen”.
Funcionalidades dentro del Resumen de la Red de Display
Barra de métricas
Una vez dentro de él nos encontramos con una barra con las métricas básicas de la campaña, que en este caso son: Clics, CTR, Impresiones, Conversiones, Coste por conversión, Porcentaje de conversiones y Coste. Podemos hacer clic en cada una de ellas para revisar las tarjetas de segmentación que se mostrarán a continuación en base a los datos de la métrica que hayamos seleccionado.
Una debilidad de esta herramienta que creo conveniente resaltar es que únicamente podemos conocer la información de estas siete métricas. Por lo tanto, habrá casos en los que no nos sea demasiado útil, por ejemplo, si queremos trabajar con Clics convertidos en lugar de Conversiones (y consiguientemente con Coste por clic convertido y Porcentaje de clics convertidos). La inexistente opción de reemplazar estas métricas por otras limita su uso, y desde aquí queremos aprovechar para hacer un llamado a los señores de Google ya que implementarla haría esta herramienta más usable.
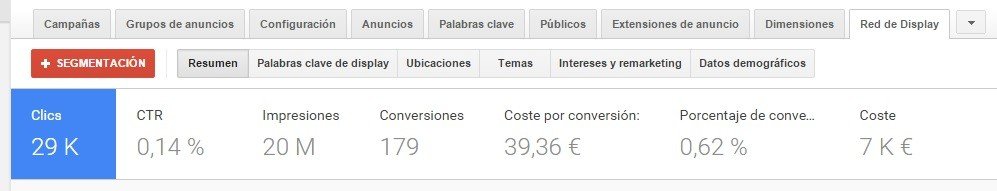
Barra con las distintas métricas que ofrece el Resumen de Display.
Tarjetas de segmentación
Habiendo ya seleccionado cualquiera de las métricas se nos muestran distintas estadísticas en forma de tarjetas de segmentación, una por cada uno de los métodos de segmentación disponibles (Palabras clave de Display, Ubicaciones, Temas, Intereses y remarketing y Datos demográficos).
Si bien es cierto que resulta muy gráfico y visual el Resumen de la Red de Display a la hora de identificar de un primer vistazo los criterios de segmentación que mejor rendimiento tienen, también es cierto que es un apartado meramente informativo, y necesitamos salir de esta función para poder realizar cualquier optimización. Resultaría muy útil tener la posibilidad de hacer clic en la porción del gráfico que representa a la palabra clave de display con mejor rendimiento y poder aplicarle un ajuste de puja directamente desde la misma tarjeta.
Es posible lanzar el Resumen tanto a nivel de cuenta como a nivel de campaña o de grupo de anuncios. Las tarjetas de segmentación se mostrarán para todos los niveles, siempre y cuando los métodos de segmentación tengan estadísticas suficientes para cada una de las métricas.
Qué tipos de gráficos nos encontramos
Gráficos Circulares
Los gráficos circulares representan el peso porcentual de cada uno de los criterios de segmentación específica con relevancia suficiente, sobre el total de los criterios específicos dentro de un mismo tipo de segmentación (p.e: Palabras clave de Display). De este modo, cada criterio se encuentra representado por una porción de un tamaño y color distintos.
También podemos desplegar la opción “Mostrar texto destacado” para ver la leyenda del gráfico.
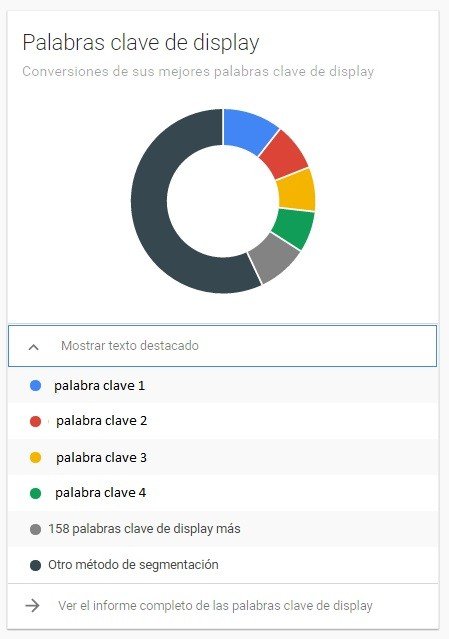
Ejemplo de un gráfico circular del Resumen de Display.
Las métricas que se muestran en forma de gráfica circular son las Conversiones, las Impresiones visibles de Active View, los Clics, y el Coste.
Gráficos de Barras
Los gráficos de barras ordenan de mayor a menor los datos porcentuales de los criterios específicos para cada tipo de segmentación. En el caso de que existan muchos datos de rendimiento, la tarjeta únicamente mostrará los elementos con mayor repercusión.
Las métricas que representan este tipo de gráficos son las de Porcentaje de clics, Coste por conversión y Porcentaje de conversiones.
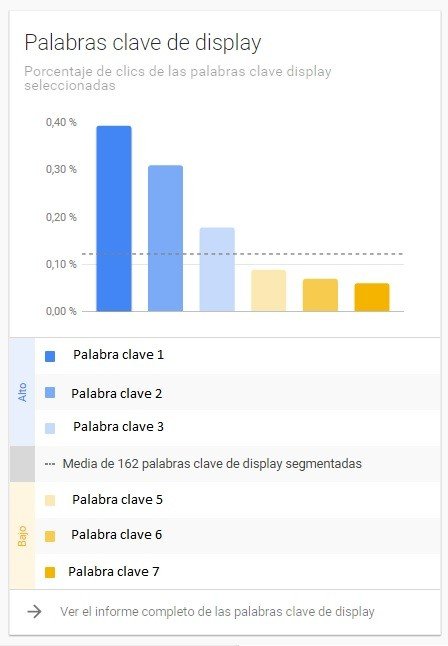
Ejemplo de un gráfico de barras del Resumen de Display.
¿Qué opinas tú de esta funcionalidad? ¿Qué tal te ha funcionado a ti el Resumen de la Red de Display?