
Cómo crear segmentos en Google Analytics
Cómo crear segmentos en Google Analytics para obtener un mayor número de conversiones
Google analytics nos permite configurar infinidad de parámetros, entre ellos, segmentos que nos van a ayudar a obtener un mayor número de conversiones. Cuando entramos en Google Analytics y observamos el volumen de datos que disponemos, es muy habitual que nos surjan preguntas: ¿qué comportamiento tienen los usuarios que realizaron una conversión en nuestro sitio web? ¿cuál es el dispositivo que utilizan habitualmente para comprar en nuestro website? ¿cuáles son las páginas más populares para los usuarios que nos visitan desde una ciudad o país en concreto?
Los segmentos de Google Analytics nos permiten estructurar o agrupar el tráfico para profundizar en el análisis de datos y responder a preguntas relacionadas con el comportamiento de los usuarios.
Puede que en ocasiones no sepamos muy bien identificar en qué métricas o KPI´s debemos fijarnos, tener una buena configuración de los segmentos en analytics nos puede ayudar y ofrecer información muy valiosa, ¡además de ahorrarnos mucho tiempo!
Tipología de segmentos en Google Analytics
Google Analytics incorpora en su propia plataforma unos segmentos predefinidos y, en caso necesario, pero además podemos crear nuevos segmentos en función de nuestras necesidades.
Algunos de los segmentos predefinidos más usuales son:
- Visitantes: nuevos o recurrentes.
- Tráfico: de búsqueda, referencia, directo o de pago.
- Sesiones con conversiones, rebote, transacciones.
¿Cómo podemos ver los segmentos en Google Analytics?
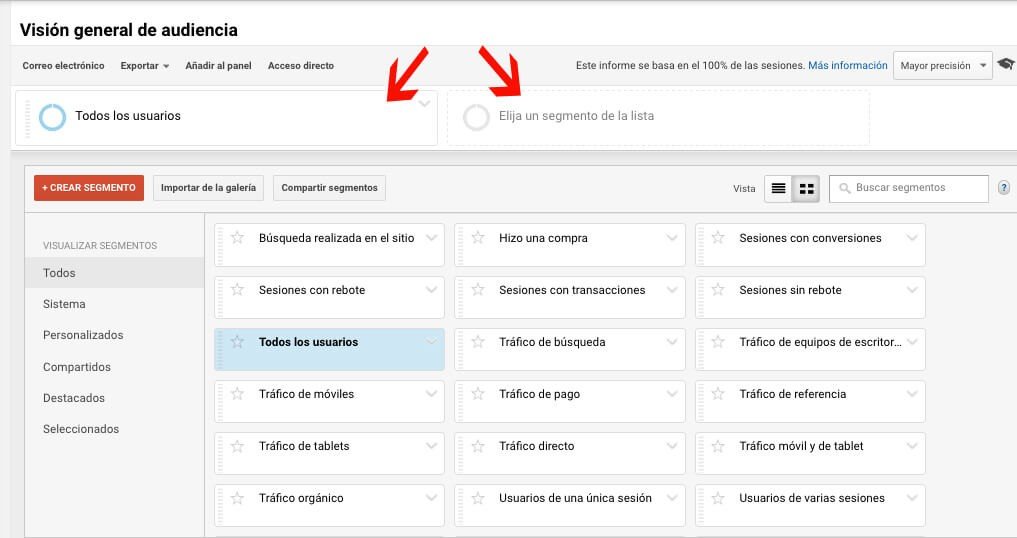
En el informe de Audiencia -> Visión General del Público, encontramos en la zona superior que ya está por defecto el segmento “todos los usuarios” o bien, podemos seleccionar un segmento predefinido que ya viene incorporado en la lista que observamos a continuación:
Llegados a este punto, os preguntaréis, ¿cuál es el mejor segmento para implementar en mi ecommerce? ¿Cómo me pueden ayudar los segmentos a tener más visitas en mi blog? ¿puedo crear un segmento más avanzado que siga distintas fases en el comportamiento de los usuarios?
La realidad es que no hay una respuesta determinada, en función de la tipología de tu sitio web y de tus objetivos y por lo tanto de tus KPI´s, optarás por un segmento u otro, o tendrás que configurar un segmento nuevo siguiendo tus propias necesidades. Los segmentos nos permiten analizar los datos, por ello, no debemos caer en el error de intentar aplicarlos todos, sino aquellos que realmente nos proporcionen datos para cumplir con nuestro objetivo.
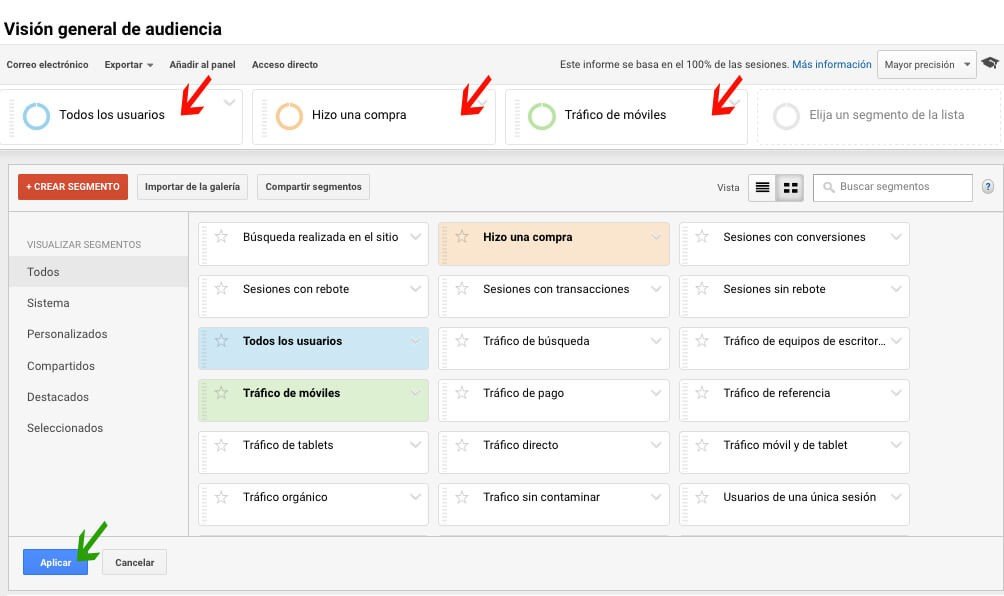
Por ejemplo, si tengo una ecommerce, me puede interesar conocer “de todos los usuarios, cuántos hicieron una compra a través del móvil”, o “de todos los usuarios cuál de ellos hizo una determinada acción dentro de mi web”. La forma de hacerlo sería como observamos en la imagen. Seleccionamos los 3 segmentos sombreados y los aplicamos:
Una vez aplicados, los datos que nos muestra GA son los siguientes:
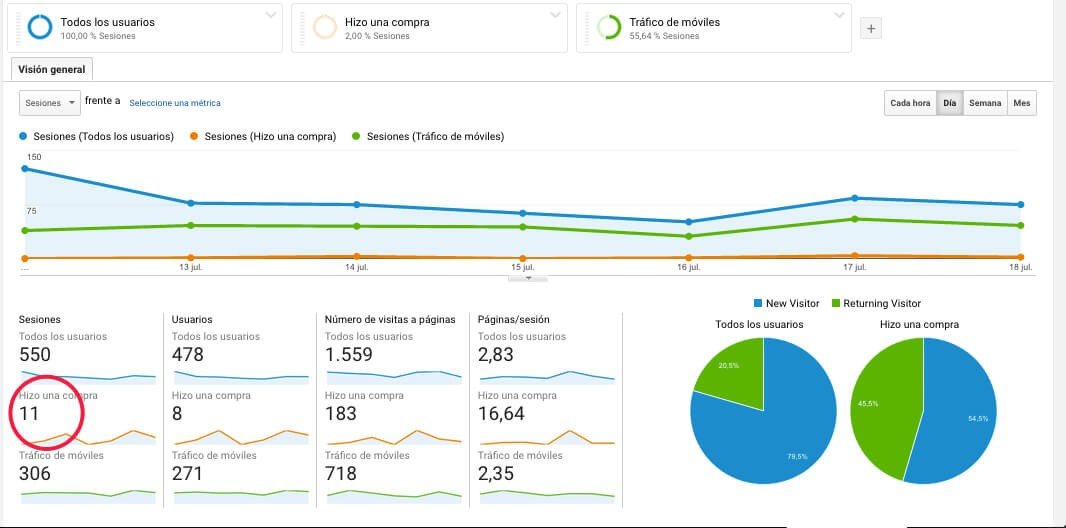
Como observamos en la imagen, cada color corresponde a los datos de un segmento. Los datos más relevantes que podemos extraer de este análisis son que para el período determinado (en este caso una semana), -cada persona determinará el tiempo en función de lo que necesite medir: día, semana, mes, trimestre…-, observamos que de todas las sesiones a través del móvil, se efectuaron 11 compras. ¿Cómo podemos interpretar este resultado?
A nuestro parecer, lo más interesante sería compararlo con el total de compras que se efectuaron en el mismo período desde otro dispositivo, por ejemplo, un ordenador. De este modo, podríamos saber si nuestros usuarios nos compran más a través de un dispositivo u otro y realizar una campaña para impulsar ventas por dispositivo.
Segmentos personalizados en Google analytics
Además de esta información, tal y como hemos mencionado antes, podemos crear segmentos personalizados de acuerdo a lo que necesitemos para el análisis de la información.
Para crear un nuevo segmento, accedemos de la misma forma que para visualizar los segmentos predefinidos. En este caso, le hacemos clic a crear un nuevo segmento y describimos el nombre y los parámetros que deseamos que tenga nuestro segmento. Un proceso muy sencillo que nos va permitir obtener datos 100% personalizados sobre nuestro site.
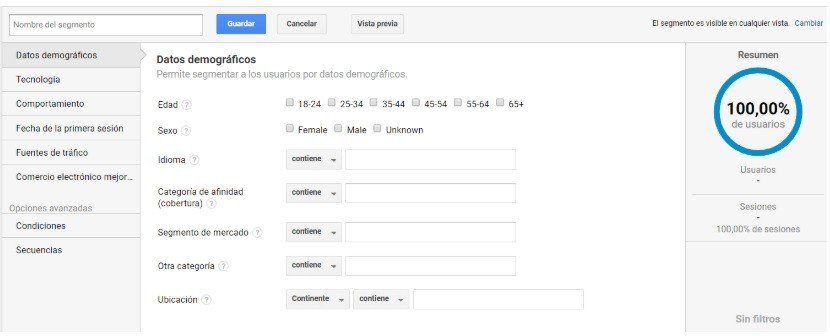
Tal y como podemos ver en la imagen anterior, los parámetros que podemos seleccionar cuando creamos el segmento son los referidos a datos demográficos (Edad, sexo, idioma…); tecnología (Navegador, dispositivo, pantalla…), Comportamiento (Sesiones, duracción de la sesión, transacciones…) y fuentes de tráfico y funcionalidades del comercio electrónico avanzado si lo tenemos configurado en nuestra cuenta de Analytics.
También podemos crearlo a partir de “Condiciones”, por ejemplo, “visitas desde Facebook a través de dispositivos móviles que nos llegan desde Valencia”. La opción de “condiciones” nos permite seleccionar las dimensiones y métricas de aquellos elementos que necesitamos medir. En el ejemplo citado, hemos seleccionado 3 elementos: Dimensiones, Categoría de dispositivo y Ciudad, como observamos en la imagen:
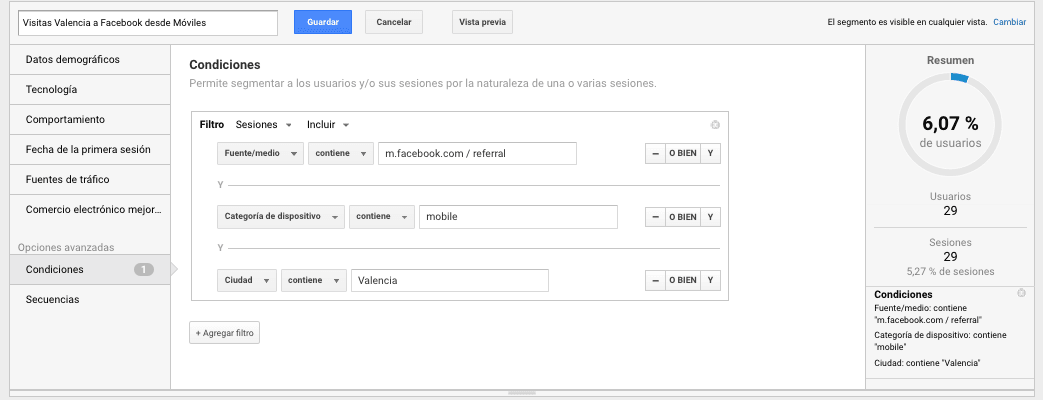
En la parte superior observamos el nombre del segmento. Es muy importante que siempre utilicemos un nombre lo más descriptivo posible para evitar confundirnos con otro segmento. Otra consideración a tener en cuenta es que antes de guardar el segmento, recomendamos hacer clic en “Vista previa” para ver que realmente funciona y su implementación es correcta.
Además, en la parte de la derecha podemos ver los datos que nos muestra el segmento.
Gracias a los segmentos personalizados podemos agrupar diferentes datos que no vienen predefinidos para optimizar al máximo nuestro site. Si vais a comenzar a aplicar y crear segmentos, os recomendamos primero trazar un plan para conocer cuáles son aquellos que realmente me van a aportar información valiosa para cumplir con mis objetivos de marketing. Planificar los segmentos a desarrollar es el paso más importante en todo el proceso, por ello, os aconsejamos que os toméis vuestro tiempo para hacerlo con tranquilidad.
Además de crear nuevos segmentos, podemos compartir segmentos ya creados con otros usuarios, debemos tener en cuenta que al compartir estos segmentos, se comparte la configuración, no los datos. Para compartirlos lo haremos desde el propio segmento Acciones – Compartir y copiaremos la url para dársela al usuario con el que deseamos compartir.
Y ahora, algunos tips sobre los segmentos de Google Analytics:
- Los segmentos se aplican en el histórico de datos, por lo que tienen carácter retroactivo. Nos permiten de forma inmediata obtener información de datos históricos.
- Podemos seleccionar hasta 4 segmentos para aplicar en los informes.
- Son un elemento muy efectivo cuando queremos agrupar a nuestro tráfico, siguiendo las directrices de la estrategia que previamente hemos determiando.
- Los segmentos no se pueden aplicar a los informes en tiempo real de Google Analytics.
- Aunque los segmentos son creados por un usuario de Google Analytics, tal y como hemos comentado, se pueden compartir. Por ejemplo, si somos una agencia o trabajamos varias personas para un mismo cliente, podemos compartir los segmentos con otros usuarios y así tenerlos configurados cada vez que trabajemos con la cuenta.
- Algunos segmentos que pueden resultar muy útil cuando nos encontramos con el análisis del tráfico de un ecommerce pueden ser: conocer el número de veces que un usuario nos visita hasta realizar una compra, identificar el comportamiento de los usuarios con una cesta media muy alta, etc… Al final se trata de conocer qué datos son los que nos ayudan a entender mejor el comportamiento de nuestros usuarios y por lo tanto tomar decisiones y hacer test y cambio s en base a esto.
¡Muchas gracias por leernos! Si trabajáis con segmentos, no dudéis en comentarnos cuáles son los que más utilizáis y el por qué.
Además, ¡también nos podéis dar más ideas sobre segmentos personalizados! Hay infinidad que podemos crear 🙂